Tumor suppressive function of microRNA-192 in acute lymphoblastic leukemia

Authors

  • Mahtab Sayadi Department of Hematology, Allied Medical School, Tehran University of Medical Sciences, Tehran, Iran
  • Soheila Ajdary Department of Immunology, Pasteur Institute of Iran, Tehran, Iran
  • Fatemeh Nadali Department of Hematology, Allied Medical School, Tehran University of Medical Sciences, Tehran, Iran
  • Shahrbano Rostami Department of Hematology, Hematology and Oncology and Stem Cell Transplantation Research Center, Tehran University of Medical Sciences, Tehran, Iran
  • Mahdi Edalati Fahtabad Department of Hematology, Allied Medical School, Tehran University of Medical Sciences, Tehran, Iran

DOI:

https://doi.org/10.17305/bjbms.2017.1921

Keywords:

Acute lymphoblastic leukemia, apoptosis, cell cycle, miroRNA-192, ALL, P53, BAX, CASP3, BCL-2

Abstract

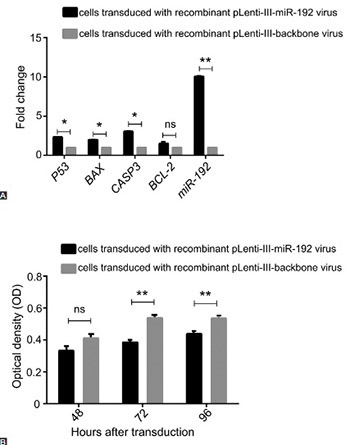
Non-coding RNAs play a critical role in gene regulation in cancer cells. Reduced expression of microRNA-192 (miR-192) has been detected in many cancers. In this study, we investigated the role of miR-192 in cell proliferation and cell cycle control in NALM-6 cell line, a model of acute lymphoblastic leukemia (ALL). Cell cycle analysis by DNA content using propidium iodide staining and cell apoptosis analysis using Annexin V assay were carried out. Cell proliferation changes were monitored using 3-(4,5-dimethylthiazol-2-yl)-2,5-diphenyltetrazolium bromide assay. In addition, the relative changes in P53, BAX, CASP3, and BCL-2 gene expression were determined by quantitative reverse transcription PCR. Overexpression of miR-192 resulted in cell proliferation arrest in ALL cells. After 72 and 96 hours of transduction, apoptosis was significantly increased in the cells transduced with miR-192-overexpressing virus compared with control cells. The expression of P53, BAX, and CASP3 increased after 48 hours of transduction in miR-192-overexpressing cells, but no change was observed in BCL-2 expression. The G0/S and G1/S ratio changed to 7.5 and 4.5, respectively, in the cells overexpressing miR-192 compared with controls. The results of our study suggest, for the first time, tumor suppressive effects of miR-192 in ALL cells.

Downloads

Download data is not yet available.

Author Biographies

Mahtab Sayadi, Department of Hematology, Allied Medical School, Tehran University of Medical Sciences, Tehran, Iran

Department of Hematology

Soheila Ajdary, Department of Immunology, Pasteur Institute of Iran, Tehran, Iran

Department of Immunology

Fatemeh Nadali, Department of Hematology, Allied Medical School, Tehran University of Medical Sciences, Tehran, Iran

Department of Hematology

Shahrbano Rostami, Department of Hematology, Hematology and Oncology and Stem Cell Transplantation Research Center, Tehran University of Medical Sciences, Tehran, Iran

Department of Hematology

Mahdi Edalati Fahtabad, Department of Hematology, Allied Medical School, Tehran University of Medical Sciences, Tehran, Iran

Department of Hematology

References

Bartel DP. MicroRNAs: Genomics, biogenesis, mechanism, and function. Cell 2004;116(2):281-97. https://doi.org/10.1016/S0092-8674(04)00045-5.

Bartel DP. MicroRNAs: Target recognition and regulatory functions. Cell 2009;136(2):215-33. https://doi.org/10.1016/j.cell.2009.01.002.

Ruvkun G. Clarifications on miRNA and cancer. Science 2006;311(5757):36-7. https://doi.org/10.1126/science.311.5757.36d.

Zhang B, Pan X, Cobb GP, Anderson TA. microRNAs as oncogenes and tumor suppressors. Dev Biol 2007;302(1):1-12. https://doi.org/10.1016/j.ydbio.2006.08.028.

Xi Y, Shalgi R, Fodstad O, Pilpel Y, Ju J. Differentially regulated micro-RNAs and actively translated messenger RNA transcripts by tumor suppressor p53 in colon cancer. Clin Cancer Res 2006;12(7 Pt 1):2014-24. https://doi.org/10.1158/1078-0432.CCR-05-1853.

Lim LP, Glasner ME, Yekta S, Burge CB, Bartel DP. Vertebrate microRNA genes. Science 2003;299(5612):1540. https://doi.org/10.1126/science.1080372.

Hino K, Tsuchiya K, Fukao T, Kiga K, Okamoto R, Kanai T, et al. Inducible expression of microRNA-194 is regulated by HNF-1alpha during intestinal epithelial cell differentiation. RNA 2008;14(7):1433-42. https://doi.org/10.1261/rna.810208.

Tan Y, Ge G, Pan T, Wen D, Chen L, Yu X, et al. A serum microRNA panel as potential biomarkers for hepatocellular carcinoma related with hepatitis B virus. PLoS One 2014;9(9):e107986. https://doi.org/10.1371/journal.pone.0107986.

Feinberg-Gorenshtein G, Guedj A, Shichrur K, Jeison M, Luria D, Kodman Y, et al. MiR-192 directly binds and regulates Dicer1 expression in neuroblastoma. PLoS One 2013;8(11):e78713. https://doi.org/10.1371/journal.pone.0078713.

Jin Z, Selaru FM, Cheng Y, Kan T, Agarwal R, Mori Y, et al. MicroRNA-192 and -215 are upregulated in human gastric cancer in vivo and suppress ALCAM expression in vitro. Oncogene 2011;30(13):1577-85. https://doi.org/10.1038/onc.2010.534.

Song B, Wang Y, Kudo K, Gavin EJ, Xi Y, Ju J. miR-192 regulates dihydrofolate reductase and cellular proliferation through the p53-microRNA circuit. Clin Cancer Res 2008;14(24):8080-6. https://doi.org/10.1158/1078-0432.CCR-08-1422.

Schotte D, De Menezes RX, Akbari Moqadam F, Khankahdani LM, Lange-Turenhout E, Chen C, et al. MicroRNA characterize genetic diversity and drug resistance in pediatric acute lymphoblastic leukemia. Haematologica 2011;96(5):703-11. https://doi.org/10.3324/haematol.2010.026138.

Muller PA, Vousden KH. p53 mutations in cancer. Nat Cell Biol 2013;15(1):2-8. https://doi.org/10.1038/ncb2641.

Surget S, Khoury MP, Bourdon JC. Uncovering the role of p53 splice variants in human malignancy: A clinical perspective. Onco Targets Ther 2013;7:57-68. https://doi.org/10.2147/OTT.S53876.

Tudzarova S, Mulholland P, Dey A, Stoeber K, Okorokov AL, Williams GH, et al. p53 controls CDC7 levels to reinforce G1 cell cycle arrest upon genotoxic stress. Cell Cycle 2016;15(21):2958-72. https://doi.org/10.1080/15384101.2016.1231281.

Taylor WR, Stark GR. Regulation of the G2/M transition by p53. Oncogene 2001;20(15):1803-15. https://doi.org/10.1038/sj.onc.1204252.

Khella HW, Bakhet M, Allo G, Jewett MA, Girgis AH, Latif A, et al. miR-192, miR-194 and miR-215: A convergent microRNA network suppressing tumor progression in renal cell carcinoma. Carcinogenesis 2013;34(10):2231-9. https://doi.org/10.1093/carcin/bgt184.

Lu J, Getz G, Miska EA, Alvarez-Saavedra E, Lamb J, Peck D, et al. MicroRNA expression profiles classify human cancers. Nature 2005;435(7043):834-8. https://doi.org/10.1038/nature03702.

Schwartz D, Almog N, Peled A, Goldfinger N, Rotter V. Role of wild type p53 in the G2 phase: Regulation of the gamma-irradiation-induced delay and DNA repair. Oncogene 1997;15(21):2597-607. https://doi.org/10.1038/sj.onc.1201436.

Oltvai ZN, Milliman CL, Korsmeyer SJ. Bcl-2 heterodimerizes in vivo with a conserved homolog, Bax, that accelerates programmed cell death. Cell 1993;74(4):609-19. https://doi.org/10.1016/0092-8674(93)90509-O.

Weng C, Li Y, Xu D, Shi Y, Tang H. Specific cleavage of Mcl-1 by caspase-3 in tumor necrosis factor-related apoptosis-inducing ligand (TRAIL)-induced apoptosis in Jurkat leukemia T cells. J Biol Chem 2005;280(11):10491-500. https://doi.org/10.1074/jbc.M412819200.

Jin Y, Lu J, Wen J, Shen Y, Wen X. Regulation of growth of human bladder cancer by miR-192.Tumour Biol 2015;36(5):3791-7. DOI: 10.1007/s13277-014-3020-8.

Tumor suppressive function of microRNA-192 in acute lymphoblastic leukemia

Downloads

Additional Files

Published

2017-08-20

How to Cite

1.
Sayadi M, Ajdary S, Nadali F, Rostami S, Edalati Fahtabad M. Tumor suppressive function of microRNA-192 in acute lymphoblastic leukemia. Biomol Biomed [Internet]. 2017Aug.20 [cited 2023Mar.27];17(3):248-54. Available from: https://www.bjbms.org/ojs/index.php/bjbms/article/view/1921

Issue

Section

Molecular Biology

INTRODUCTION

MicroRNAs (miRNAs) are small, endogenous, non-coding single-stranded RNAs approximately 20-25 nucleotides long that play key roles in post-transcriptional regulation of gene expression in multicellular organisms [1]. These small sequences usually bind to the 3’-untranslated region (3’-UTR) of the target mRNA through imperfect base-pairing, and either block translation or promote degradation of the target mRNA [2]. Based on the function of the target genes, miRNAs can act as oncogenic (oncomiR) or tumor suppressive, and play a critical role in the carcinogenesis due to changes in the expression of regulatory proteins [3-5].

In 2003, microRNA-192 (miR-192) was confirmed by Lim et al. as a newly identified miRNA [6]. The MIR192 gene is transcribed together with miR-194 [7]. Several studies reported the upregulation of miR-192 in different cancer types, including gastric cancer, hepatocellular carcinoma, and neuroblastoma [8-10]. Conversely, miR-192 was downregulated in colorectal cancer and hematological disorders, as well as in lymphoblastic leukemia (ALL) where it was associated with poor prognosis (Supplemental Table 1) [11,12]. The TP53 gene is a direct transcriptional target of miR-192, which contributes to the tumor suppressive role of this miRNA. miR-192 affects the regulation of cell cycle and proliferation by regulating the TP53 expression [11].

SUPPLEMENTAL TABLE 1: Changes in microRNA-192 (miR-192) expression associated with different cancers

The p53 tumor suppressor protein plays a critical role in the survival of normal and suppression of tumor cells by controlling downstream target genes [13]. Importantly, among all tumor suppressor genes and oncogenes, TP53 is the most frequently mutated gene in different human cancers, indicating the important role of p53 tumor suppressor protein in cancer development [14]. The activation of p53 can induce cell cycle arrest in the G1 checkpoint of the cell cycle [15]. In addition, after cell damage, p53 is activated by kinases and the activated p53 induces downregulation of cell cycle regulators and triggers cell cycle arrest in the G2 phase [16].

In the present study, we evaluated the effect of miR-192 overexpression in an ALL cell line. The overexpression of miR-192 led to p53-dependent G1 and G2-M cell cycle arrest. p53-induced caspase-3 activation was followed by apoptosis. Overall, our results showed that by regulating the expression of key cell cycle genes, miR-192 can mediate cell cycle and proliferation arrest in an ALL cell line.

MATERIALS AND METHODS

Cell culture

The B-cell precursor leukemia cell line NALM-6 was purchased from the Pasteur Institute of Iran. The cells were cultured in Roswell Park Memorial Institute (RPMI) 1640 medium with 10% fetal bovine serum (FBS) and 100 U/ml penicillin-streptomycin, and kept in a humidified atmosphere at 37°C with 5% CO2. The Lenti-X™ 293T cell line was obtained from the Department of Virology, Pasteur Institute of Iran. The cells were cultured in high-glucose Dulbecco’s Modified Eagle’s Medium (DMEM) with 10% FBS and 100 U/ml penicillin-streptomycin.

Lentivirus construction and transfection

The recombinant lentivirus expressing miR-192 was constructed using pLenti-III-miR-192- green fluorescent protein (GFP) (ABM, Richmond, BC, Canada) and psPAX and pMD2G packaging plasmids, in Lenti-X™ cells. pLenti-III-blank-GFP plasmid was used for constructing the backbone viral vector. Lenti-X™ cells were cultured 1 day prior to the transfection so the cells could reach 80-90% confluence on the day of transfection. The transfections were performed using Lipofectamine 3000 (Invitrogen, Carlsbad, CA, USA), with the recombinant lentiviral packaging system and expressing plasmids, and the cells were incubated at 37°C. The lentiviral transduction efficiency was determined by analyzing the GFP-expressing lentivirus under fluorescence microscopy, 24 hours after the transduction. The supernatant was collected every 24 hours for 3 days. The viruses were concentrated using ultracentrifugation at 45 000 rpm, resuspended in phosphate-buffered saline (PBS), and kept at −80°C until use.

Transduction and confirmation

The cells were transduced with the recombinant lentiviruses expressing miR-192 and backbone viral vector using spinfection at 1400×g for 1 hour at 36°C. After 24 hours, the GFP expression was analyzed in the cells, using fluorescence microscopy and flow cytometry.

RNA isolation and quantitative reverse transcription PCR (RT-qPCR) analysis of miRNAs

The total RNA content, including miRNAs, was isolated from the transduced and control cells using the RNX plus reagent (CinnaGen, Tehran, Iran) according to the manufacturer’s instructions, 48 hours after the transduction. The RNA extracts were kept at −80°C until use. Next, 5 μg of total RNA, used as a template, was polyadenylated with poly(A) polymerase enzyme. Complementary DNA (cDNA) was synthesized using a cDNA synthesis kit (Fermentas, Massachusetts, USA) and specific primers. The sequence-specific RT-qPCR primers for miR-192 and endogenous control SNORD were purchased from Bonyakhteh Research Center, Iran. RT-qPCR analysis was carried out on the Rotor-gene 6000 real-time PCR device (Corbett, Mortlake, Australia) using Taq DNA Polymerase Master Mix (Ampliqon, Rodovre, Denmark), and the following PCR conditions were applied: 95°C for 10 minutes and then 95°C for 15 seconds, 60°C for 60 seconds for up to 40 cycles (n = 3). The gene expression cycle threshold (∆∆Ct) values of miRNAs were calculated after normalizing with SNORD internal control.

Cell proliferation assay

NALM-6 cells were divided into three groups for transduction. One group was transduced with recombinant lentiviruses expressing miR-192, the second, control, group was transduced with the backbone virus, and the third group was untreated and also used as a control group. Five mg/ml of the 3-(4,5-Dimethylthiazol-2-yl)-2,5-diphenyltetrazolium bromide (MTT) solution (Sigma-Aldrich, MO, USA) was added and the cells were incubated at 37°C for 3 hours; after that, an equal volume of dimethyl sulfoxide was added. The absorbance was measured at 570 nm with background subtraction at 630 nm. The MTT assay was performed at 48, 72, and 98 hours after the transduction.

Cell cycle analysis

NALM-6 cells (1 × 10⁶) were transduced as previously described. After 48 hours, the cells were collected and washed with PBS. After fixation in 98% ethanol, the cells were washed in PBS. Then, RNase A (100 μg/ml) and 200 μg/ml of propidium iodide (PI) (Sigma-Aldrich, MO, USA) were added. Flow cytometry was used to analyze the cell cycle on a Partec device (Partec, Muenster, Germany), and FlowJo software 8.7.1 (Tree star, Ashland, OR, USA) was used for data analysis and cell cycle modeling. Untreated and fresh cells were used as controls.

Apoptosis analysis by flow cytometry

The cells were examined at a density of 1× 10⁶ cells/ml, 72 and 96 hours after the transduction. The Annexin V-PE Apoptosis Detection Kit (eBioscience, CA, USA) was used to analyze apoptosis, according to the manufacturer’s instructions. The apoptotic cells were detected and quantified using the Partec device. Data were analyzed using the FloMax software (Partec). Untreated and stained cells were used as controls for gating.

RT-qPCR analysis of mRNA expression

The cDNA was synthesized using the cDNA synthesis kit (Fermentas), with 1 μg of total RNA as a template and random hexamer primers. The PCR primers for the P53, BAX, CASP3, BCL-2, and GAPDH as the internal control gene were designed and synthesized by Bioneer Company [Tehran, Iran] (Table 1). RT-qPCR was performed using the Rotor-gene 6000 real-time PCR device under the following conditions: 95°C for 15 seconds, and 60°C for 1 minute for up to 40 cycles (n = 3). The gene expression ∆∆CT values of mRNAs and relative quantitation values were calculated after normalizing with GAPDH.

TABLE 1: Primer sequences used in quantitative reverse transcription PCR (RT-qPCR) analysis

Statistical analysis

We used Student’s t-test to evaluate the statistical significance between different groups and the analysis was performed with the GraphPad Prism software version 7.0 (La Jolla, California, USA). A value of p < 0.05 was considered statistically significant.

RESULTS

Lentivirus construction

The concentrations of recombinant viruses expressing miR-192 and backbone vector were determined by titration in Lenti-X™ 293T and NALM-6 cells (data not shown). We confirmed significantly increased expression of miR-192 in NALM-6 cells transduced with the recombinant lentivirus expressing miR-192 in comparison with cells transduced with the backbone vector (Figure 1A).

FIGURE 1: Expression analysis of P53, BAX, CASP3, BCL-2, and microRNA-192 (miR-192) in NALM-6 cells transduced with recombinant pLenti-III-miR-192 virus versus cells transduced with recombinant pLenti-III-backbone virus (transduced control cells). (A) Forty-eight hours after the transduction with recombinant pLenti-III-miR-192 and recombinant pLenti-III-backbone viruses, changes in gene expressions were measured using quantitative reverse transcription PCR (RT-qPCR). Data are expressed as fold change relative to the transduced control cells with an assigned value of 1. (B) The overexpression of miR-192 caused suppression of the proliferation in acute lymphoblastic leukemia cells. The 3-(4,5-Dimethylthiazol-2-yl)-2,5-diphenyltetrazolium bromide MTT assay was applied to determine the viability of NALM-6 cells transduced with recombinant pLenti-III-miR-192 virus and of control cells transduced with recombinant pLenti-III-backbone virus, after 48, 72, and 96 hours of transduction. *p < 0.05, **p < 0.01%, ns: not significant.

The effect of miR-192 overexpression on the cell proliferation was evaluated in NALM-6 cells using MTT assay at various time points. The results showed that the overexpression of miR-192 in NALM-6 cells resulted in suppression of the proliferation compared with the controls (Figure 1B). The suppression was not significant after 48 hours; however, a statistically significant decrease was detected 72 and 96 hours after the transduction.

Effect of increased miR-192 expression on cell cycle

To determine the effect of miR-192 on cell cycle regulation, we performed cell cycle analysis using PI and flow cytometry. The results showed that the overexpression of miR-192 caused an increase in G1-S (>7-fold) and G2-S (>4.5-fold) ratio in NALM-6 cells compared with the control cells, as shown in Figure 2.

FIGURE 2: The effects of microRNA-192 (miR-192) overexpression on cell cycle in NALM-6 cell line. The cells transduced with recombinant pLenti-III-miR-192 virus and the control cells transduced with recombinant pLenti-III-backbone virus were stained with propidium iodide (FL2) after 48 hours, followed by flow cytometry analysis. (A) Untreated control group, (B) cells transduced with recombinant pLenti-III-miR-192, (C) control cells transduced with recombinant pLenti-III-backbone virus, (D) a comparison of G1/S and G2/S fold changes between the three cell groups.

We next examined the effect of miR-192 overexpression on apoptosis by Annexin V-PE, 72 and 96 hours after the transduction. After 72 hours, 66% of the cells expressing miR-192 were Annexin V-positive versus 44% of the cells expressing the backbone virus; after 96 hours, 37% of the cells expressing miR-192 were Annexin V-positive versus 18% of the cells expressing the backbone virus (p < 0.01%) (Figure 3).

FIGURE 3: microRNA-192 (miR-192) promotes apoptosis in NALM-6 cells. The cells transduced with recombinant pLenti-III-miR-192 virus versus control cells transduced with recombinant pLenti-III-backbone virus. Seventy-two and 96 hours after the transduction, the cells were stained with Annexin V-PE and flow cytometry analysis was performed. (A) Untreated control group, (B) cells transduced with recombinant pLenti-III-miR-192 after 72 hours, (C) control cells transduced with recombinant pLenti-III-backbone virus after 72 hours, (D) cells transduced with recombinant pLenti-III-miR-192 after 96 hours, (E) control cells transduced with recombinant pLenti-III-backbone virus after 96 hours, (F) a comparison of Annexin V-positive cells 72 and 96 hours following the transduction, in the three cell groups. **p < 0.01.

To examine the potential mechanism underlying the effects of miR-192 on cell cycle and apoptosis, we analyzed the expression of genes involved in the cell cycle regulation and apoptosis. We evaluated P53, BCL-2, BAX, and CASP3 gene expression, 48 hours after the transduction with miR-192-expressing virus. P53, a known target of miR-192, showed a 2.53-fold increase in the cells infected with miR-192-expressing virus in comparison with the cells infected with the backbone vector. The expressions of CASP3 and BAX were upregulated in the cells with increased miR-192 expression compared with the control cells (3-fold and 2-fold increase, respectively) (p < 0.05) (Figure 1A). The BCL-2, an anti-apoptotic gene, showed no significant change in response to the increased miR-192 expression level.

DISCUSSION

miRNAs are a novel class of tumor suppressors and their aberrant expression plays a pivotal role in many tumor types [11,17]. The inhibitory effects of miR-192 in cell proliferation and in tumor development have been documented in several studies [11]. However, in some types of cancers, such as gastric cancer, neuroblastoma and pancreatic cancer, miR-192 shows tumor-promoting effects [8,10]. In the current study, we investigated the effects of miR-192 overexpression in ALL cells and our results suggest that miR-192 acts as a tumor suppressor molecule.

Aberrant expression of miR-192 in ALL can result in impaired p53 activation [12,18]. p53 is an important tumor suppressor protein that is inactivated in more than 50% of solid tumors [13]. One of the important roles of tumor suppressor genes is the induction of cell cycle arrest. Khella et al. [17] demonstrated that an increase in miR-192 and its cluster group of miRNAs (i.e., miR-194 and miR-215) caused arrest in the G1 and G2 phases of the cell cycle [17]. Consistent with these studies, our data revealed that the increased miR-192 expression in ALL cells led to the cell cycle arrest in the G1 and G2 phases. Furthermore, we showed that the overexpression of miR-192 can suppress cellular proliferation and significantly decrease the cell growth rates; our cell cycle analysis results were consistent with the cell proliferation results.

The inhibitory role of p53 in the G1 and G2 checkpoints was demonstrated in a human colorectal cancer cell line with impaired p53 tumor suppressor protein. In addition, several studies showed that the intact p53 can cause a prolonged cell cycle arrest [16,19]. In this study, we demonstrated that the increased expression of miR-192 in NALM-6 cell line expressing wild-type p53 protein, could cause cell cycle arrest in both G1 and G2 phases, and the G1/S ratio increased. In agreement with our study, Song et al. [11] demonstrated a role of miR-192 in cell cycle arrest by targeting p53 tumor suppressor protein in a model of colorectal carcinoma [11]. Our results showed that increased p53 is a direct target of miR-192.

However, contrary to the study by Song et al. [11], our results showed that the increased miR-192 expression leads to the upregulation of pro-apoptotic genes and downregulation of anti-apoptotic genes. The expressions of BAX and CASP3 genes were significantly increased, while the BCL-2 gene expression level was not changed. These results are in line with the observation that the overexpression of miR-192 triggers apoptosis. The expression of Bax, a pro-apoptotic protein, is regulated by p53 [20]. Activated Bax causes structural changes and, finally, the permeabilization of the mitochondrial outer membrane, as well as induces caspase activation, which leads to programmed cell death [21].

CONCLUSION

Altogether, our results suggest that miR-192 is important in inducing apoptosis and cell cycle arrest in ALL. Previously, it was demonstrated that low levels of miR-192 are associated with poor prognosis in ALL patients [11]. These findings suggest that miR-192-based therapy could be effective in advanced ALL patients and could improve the current therapeutic strategies for cancer treatment.

DECLARATION OF INTERESTS

The authors declare no conflict of interests.

Acknowledgements

ACKNOWLEDGMENTS

This study was financially supported by Tehran University of Medical Sciences (code: 93-04-31-27717). Laboratory experiments were performed in the Immunology Department of Pasteur Institute of Iran.

REFERENCES

  1. (). MicroRNAs: Genomics, biogenesis, mechanism, and function. Cell. https://doi.org/10.1016/S0092-8674(04)00045-5
  2. (). MicroRNAs: Target recognition and regulatory functions. Cell. https://doi.org/10.1016/j.cell.2009.01.002
  3. (). Clarifications on miRNA and cancer. Science. https://doi.org/10.1126/science.311.5757.36d
  4. , , , (). microRNAs as oncogenes and tumor suppressors. Dev Biol. https://doi.org/10.1016/j.ydbio.2006.08.028
  5. , , , , (). Differentially regulated micro-RNAs and actively translated messenger RNA transcripts by tumor suppressor p53 in colon cancer. Clin Cancer Res. https://doi.org/10.1158/1078-0432-CCR-05-1853
  6. , , , , (). Vertebrate microRNA genes. Science. https://doi.org/10.1126/science.1080372
  7. , , , , , (). Inducible expression of microRNA-194 is regulated by HNF-1alpha during intestinal epithelial cell differentiation. RNA. https://doi.org/10.1261/rna.810208
  8. , , , , , (). A serum microRNA panel as potential biomarkers for hepatocellular carcinoma related with hepatitis B virus. PLoS One. https://doi.org/10.1371/journal.pone.0107986
  9. , , , , , (). MiR-192 directly binds and regulates Dicer1 expression in neuroblastoma. PLoS One. https://doi.org/10.1371/journal.pone.0078713
  10. , , , , , (). MicroRNA-192 and -215 are upregulated in human gastric cancer in vivo and suppress ALCAM expression in vitro. Oncogene. https://doi.org/10.1038/onc.2010.534
  11. , , , , , (). miR-192 regulates dihydrofolate reductase and cellular proliferation through the p53-microRNA circuit. Clin Cancer Res. https://doi.org/10.1158/1078-0432-CCR-08-1422
  12. , , , , , (). MicroRNA characterize genetic diversity and drug resistance in pediatric acute lymphoblastic leukemia. Haematologica. https://doi.org/10.3324/haematol.2010.026138
  13. , (). p53 mutations in cancer. Nat Cell Biol. https://doi.org/10.1038/ncb2641
  14. , , (). Uncovering the role of p53 splice variants in human malignancy: A clinical perspective. Onco Targets Ther. https://doi.org/10.2147/OTT.S53876
  15. , , , , , (). p53 controls CDC7 levels to reinforce G1 cell cycle arrest upon genotoxic stress. Cell Cycle. https://doi.org/10.1080/15384101.2016.1231281
  16. , (). Regulation of the G2/M transition by p53. Oncogene. https://doi.org/10.1038/sj.onc.1204252
  17. , , , , , (). miR-192, miR-194 and miR-215: A convergent microRNA network suppressing tumor progression in renal cell carcinoma. Carcinogenesis. https://doi.org/10.1093/carcin/bgt184
  18. , , , , , (). MicroRNA expression profiles classify human cancers. Nature. https://doi.org/10.1038/nature03702
  19. , , , , (). Role of wild type p53 in the G2 phase: Regulation of the gamma-irradiation-induced delay and DNA repair. Oncogene. https://doi.org/10.1038/sj.onc.1201436
  20. , , (). Bcl-2 heterodimerizes in vivo with a conserved homolog, Bax, that accelerates programmed cell death. Cell. https://doi.org/10.1016/0092-8674(93)90509-O
  21. , , , , (). Specific cleavage of Mcl-1 by caspase-3 in tumor necrosis factor-related apoptosis-inducing ligand (TRAIL)-induced apoptosis in Jurkat leukemia T cells. J Biol Chem. https://doi.org/10.1074/jbc.M412819200
  22. , , , , (). Regulation of growth of human bladder cancer by miR-192. aTumour Biol. DOI: 10.1007/s13277-014-3020-8