Validation of Doi’s weighted average glucose as a measure of post-load glucose excursion for clinical use
DOI:
https://doi.org/10.17305/bb.2022.8807Keywords:
Diabetes mellitus, oral glucose tolerance test (GTT), weighted average glucose, Doi’s weighted average glucose (dwAG), under the curve, homeostatic model assessment for insulin sensitivity (HOMA-S)Abstract
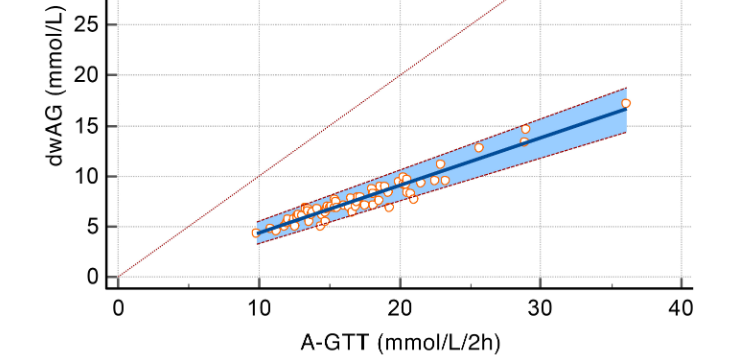
In this study, we examined the performance of a novel index of glucose excursion (Doi’s weighted average glucose [dwAG]) in relation to the conventional measure of area under the oral glucose tolerance test (A-GTT) and the homeostatic model assessment for insulin sensitivity (HOMA-S) and pancreatic beta cell function (HOMA-B). A cross-sectional comparison of the new index was conducted using 66 oral glucose tolerance tests (GTTs) performed at different follow-up times among 27 participants who had undergone surgical subcutaneous fat removal (SSFR). Comparisons across categories were made using box plots and the Kruskal-Wallis one-way ANOVA on ranks. Passing-Bablok regression was used to compare the dwAG against the conventional A-GTT. The Passing-Bablok regression model suggested a cutoff for normality for the A-GTT of 15.14 mmol/L·2h-1 compared to the dwAG’s suggested threshold of 6.8 mmol/L. For every 1 mmol/L·2h-1 increase in A-GTT, the dwAG value increased by 0.473 mmol/L. The glucose area under the curve correlated well with the four defined dwAG categories, with at least one of the categories having a different median A-GTT value (KW Chi2 = 52.8 [df = 3], P < 0.001). The HOMA-S tertiles were also associated with significantly different levels of glucose excursion measured through both the dwAG value (KW Chi2 = 11.4 [df = 2], P = 0.003) and A-GTT measure (KW Chi2 = 13.1 [df = 2], P = 0.001). It is concluded that the dwAG value and categories serve as a simple and accurate tool that can be used for interpreting glucose homeostasis across clinical settings.
Citations
Downloads
Downloads
Additional Files
Published
Issue
Section
Categories
License
Copyright (c) 2023 Saif Badran, Suhail A. Doi, Atalla Hammouda, Omran A. H. Musa, Abdella M. Habib

This work is licensed under a Creative Commons Attribution 4.0 International License.
How to Cite
Accepted 2023-03-06
Published 2023-09-04


