CSRP2 transcript levels after consolidation therapy increase prognostic prediction ability in B-cell acute lymphoblastic leukaemia

Authors

  • Lei-Ming Cao Peking University Institute of Hematology, Peking University People’s Hospital, Beijing Key Laboratory of Hematopoietic Stem Cell Transplantation, Beijing, China
  • Ya-Lan Zhou Peking University Institute of Hematology, Peking University People’s Hospital, Beijing Key Laboratory of Hematopoietic Stem Cell Transplantation, Beijing, China https://orcid.org/0000-0002-7059-8277
  • Robert Peter Gale Department of Immunology and Inflammation, Centre for Haematology, Imperial College of Science, Technology and Medicine, London, UK
  • Ya-Zhen Qin Peking University Institute of Hematology, Peking University People’s Hospital, Beijing Key Laboratory of Hematopoietic Stem Cell Transplantation, Beijing, China
  • Li-Xin Wu Peking University Institute of Hematology, Peking University People’s Hospital, Beijing Key Laboratory of Hematopoietic Stem Cell Transplantation, Beijing, China
  • Ming-Yue Zhao Peking University Institute of Hematology, Peking University People’s Hospital, Beijing Key Laboratory of Hematopoietic Stem Cell Transplantation, Beijing, China
  • Xiao-Su Zhao Peking University Institute of Hematology, Peking University People’s Hospital, Beijing Key Laboratory of Hematopoietic Stem Cell Transplantation, Beijing, China
  • Yu-Hong Chen Peking University Institute of Hematology, Peking University People’s Hospital, Beijing Key Laboratory of Hematopoietic Stem Cell Transplantation, Beijing, China
  • Yu Wang Peking University Institute of Hematology, Peking University People’s Hospital, Beijing Key Laboratory of Hematopoietic Stem Cell Transplantation, Beijing, China
  • Hao Jiang Peking University Institute of Hematology, Peking University People’s Hospital, Beijing Key Laboratory of Hematopoietic Stem Cell Transplantation, Beijing, China
  • Qian Jiang Peking University Institute of Hematology, Peking University People’s Hospital, Beijing Key Laboratory of Hematopoietic Stem Cell Transplantation, Beijing, China
  • Ying-Jun Chang Peking University Institute of Hematology, Peking University People’s Hospital, Beijing Key Laboratory of Hematopoietic Stem Cell Transplantation, Beijing, China
  • Yan-Rong Liu Peking University Institute of Hematology, Peking University People’s Hospital, Beijing Key Laboratory of Hematopoietic Stem Cell Transplantation, Beijing, China
  • Lan-Ping Xu Peking University Institute of Hematology, Peking University People’s Hospital, Beijing Key Laboratory of Hematopoietic Stem Cell Transplantation, Beijing, China
  • Xiao-Hui Zhang Peking University Institute of Hematology, Peking University People’s Hospital, Beijing Key Laboratory of Hematopoietic Stem Cell Transplantation, Beijing, China
  • Xiao-Jun Huang Peking University Institute of Hematology, Peking University People’s Hospital, Beijing Key Laboratory of Hematopoietic Stem Cell Transplantation, Beijing, China; Academy for Advanced Interdisciplinary Studies, Peking-Tsinghua Center for Life Sciences, Peking University, Beijing, China.
  • Guo-Rui Ruan Peking University Institute of Hematology, Peking University People’s Hospital, Beijing Key Laboratory of Hematopoietic Stem Cell Transplantation, Beijing, China

DOI:

https://doi.org/10.17305/bb.2023.9034

Keywords:

Acute lymphoblastic leukaemia (ALL), relapse, measurable residual disease (MRD), cysteine and glycine-rich protein 2 (CSRP2), multi-parameter flow cytometry (MPFC)

Abstract

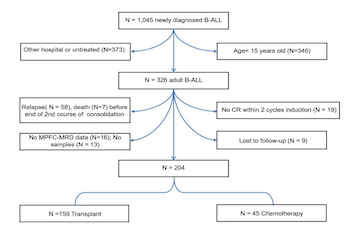
Quantification of measurable residual disease (MRD) correlates with the risk of leukemia recurrence in adults with B-cell acute lymphoblastic leukemia (ALL). However, it remains unknown whether collecting data on cysteine and glycine-rich protein 2 (CSRP2) transcript levels, after completing the second course of consolidation, improves prognosis prediction accuracy. A total of 204 subjects with B-cell ALL were tested for CSPR2 transcripts after completing the second course of consolidation using quantitative real-time polymerase chain reaction (qRT-PCR) and divided into high (N = 32) and low (N = 172) CSRP2 expression cohorts. In multivariable analyses, subjects with high expression of CSRP2 had a higher 5-year cumulative incidence of relapse (CIR) (hazard ratio [HR] = 2.57, 95% confidence interval [CI] 1.38-4.76; P = 0.003), lower 5-year relapse-free survival (RFS) (HR = 3.22, 95% CI 1.75-5.93; P < 0.001), and overall survival (OS) (HR = 4.59, 95% CI 2.64-7.99; P < 0.001) in the whole cohort, as well as in the multi-parameter flow cytometry (MPFC) MRD-negative cohort (for CIR, HR = 2.70, 95% CI 1.19-6.12; for RFS, HR = 4.37, 95% CI 1.94-9.85; for OS, HR = 4.90, 95% CI 2.43-9.90; all P < 0.05). Prognostic analysis showed that allogeneic hematopoietic stem cell transplantation (allo-HSCT) could significantly improve the prognosis of patients with high CSRP2 expression (allo-HSCT vs chemotherapy: 5-year CIR, 52% vs 91%; RFS, 41% vs 9%; OS, 38% vs 20%; all < 0.05). Our data indicate that incorporating data from CSPR2 transcript levels to the MRD-testing at the end of the second course of consolidation therapy enhances prognosis prediction accuracy in adults with B-cell ALL.

Downloads

Download data is not yet available.
CSRP2transcript levels after consolidation therapyincrease prognostic prediction ability in B-cell acutelymphoblastic leukemia

Downloads

Additional Files

Published

2023-11-03

How to Cite

1.
Cao L-M, Zhou Y-L, Gale RP, Qin Y-Z, Wu L-X, Zhao M-Y, Zhao X-S, Chen Y-H, Wang Y, Jiang H, Jiang Q, Chang Y-J, Liu Y-R, Xu L-P, Zhang X-H, Huang X-J, Ruan G-R. CSRP2 transcript levels after consolidation therapy increase prognostic prediction ability in B-cell acute lymphoblastic leukaemia. Biomol Biomed [Internet]. 2023Nov.3 [cited 2023Dec.4];23(6):1079–1088. Available from: https://www.bjbms.org/ojs/index.php/bjbms/article/view/9034

Issue

Section

Translational and Clinical Research

Introduction

In adults with B-cell acute lymphoblastic leukemia (ALL), which are completing initial therapy, there is a correlation between results of measurable residual disease (MRD) testing and subsequent risk of leukemia recurrence measured as cumulative incidence of relapse (CIR) [1–4]. Most MRD-testing in adults with acute leukemia is based on multi-parameter flow cytometry (MPFC) detection of leukemia-associated immune phenotypes (LAIPs), quantitative polymerase chain reaction (qPCR) amplification-based methods detecting fusion genes, immunoglobulin or T-cell receptor (Ig/TCR) gene rearrangements, or next-generation sequencing (NGS) detecting leukemia-associated mutations [5–8]. The patient scope and sensitivity of each method are different [9–11]. However, some studies have shown that patients who are MRD positive by a PCR-based method but MRD negative by MPFC method are at increased risk for relapse compared with patients who are MRD negative with both methods [12–14]. Consequently, additional methods with higher sensitivity for quantification of MRD and combined monitoring of multiple methods for MRD are needed to improve the ability of prognostic prediction. This would guide the refined risk stratification-based therapy, and ultimately, improve the long-term prognosis of adults with B-cell ALL.

Figure 1.: Consolidated Standards of Reporting Trials (CONSORT) flow diagram. B-ALL: B-cell acute lymphoblastic leukemia; MPFC-MRD: Multi-parameter flow cytometry-measurable residual disease.

The human cysteine and glycine-rich protein 2 gene (CSRP2) encodes the CSRP2 protein consisting of 193 amino acids with a molecular weight of about 21 KD [15]. The CSRP2 protein contains two LIM domains with an inter-domain nuclear localization signal, which may function as a tool for the control of cell growth and differentiation [16, 17]. Hoffmann et al. [18, 19] reported that CSRP2 expression was significantly upregulated in invasive breast cancer cells and its knockdown significantly reduced the invasive potential of human breast cancer cells in vitro. Tang et al. [20] reported that CSRP2 expression promoted pulmonary arteries smooth muscle cells (PASMCs) proliferation in vitro. We found that human CSRP2 transcript levels were upregulated in adults with B-cell ALL at the time of disease diagnosis, which correlated with a higher cumulative incidence relapse (CIR), especially in subjects with normal cytogenetics, and was associated with in vitro drug resistance [21]. We investigated data obtained from 204 consecutive subjects with newly diagnosed B-cell ALL, after completing initial therapy, to determine if quantifying CSRP2 expression could be used to predict relapse. We found that MRD-testing at the end of the second course of consolidation therapy by CSRP2 transcript levels was an independent predictor of relapse and survival in multivariable analyses in subjects receiving subsequent maintenance chemotherapy or an allotransplant.

Materials and methods

Subjects

A total of 1045 people with newly-diagnosed B-cell ALL were found at the Peking University Institute of Hematology from 2012 to 2019. Subjects younger than 15 years (N ═ 346) and/or subjects who received their initial therapy elsewhere (N ═ 373) were excluded from the study. In addition, 19 other subjects who did not achieve a complete hematological remission after 2 courses of induction chemotherapy were also excluded. Sixty-five of the remaining 307 subjects were excluded because of the relapse (N ═ 58) or death (N ═ 7) before completing the second consolidation therapy course. Another 9 subjects were excluded due to the discontinued follow-up, as well as 13 subjects with no available samples and 16 without complete MPFC data. The remaining 204 consecutive subjects, in the range of 15–69 years, were enrolled (Consolidated Standards of Reporting Trials diagram; Figure 1).

Diagnosis of B-cell ALL was based on World Health Organisation (WHO) 2016 criteria [22]. Hematological complete remission was defined as bone marrow lymphoblasts < 5%, granulocyte concentration > 1.0 × 10E9/L, platelet concentration > 100 × 10E9/L, hemoglobin concentration > 100 g/L, no extra-medullary leukemia and no change in these criteria for > 1 month. Relapse was defined as the number of bone marrow lymphoblasts ≥ 5% at any site in subjects achieving hematological complete remission.

Therapy for the treatment of ALL

For subjects without BCR::ABL1 fusion gene, the main induction chemotherapy was cyclophosphamide, vindesine, daunorubicin, and prednisone (CODP) with (N ═ 52) or without (N ═ 66) L-asparaginase. For BCR::ABL1 positive subjects, in the year 2017 and before, the main induction chemotherapy was CODP plus tyrosine kinase inhibitor (TKI) (N ═ 62) (imatinib, N ═ 46; dasatinib, N ═ 14; ponatinib, N ═ 2). The used therapy for the rest of the subjects was vindesine plus prednisone (VP) plus TKI (N ═ 8) (imatinib, N ═ 6; dasatinib, N ═ 2). After the year of 2017, the main induction chemotherapy was VP plus TKI (N ═ 13) (imatinib, N ═ 6; dasatinib, N ═ 5; ponatinib, N ═ 2), and the rest was CODP plus imatinib (N ═ 3). Subjects achieving a hematological complete remission received consolidation chemotherapy for ≥ 2 courses of hyper-CVAD (B), hyper-CVAD (A) (cyclophosphamide, vindesine, epirubicin, and dexamethasone) or CAM (cyclophosphamide, cytarabine, and 6-mercaptopurine). After the completion of the second course of consolidation therapy, subjects received a transplant if an appropriate HLA-identical or -matched donor was available. Other subjects were given a choice between maintenance chemotherapy with methotrexate, 6-mercaptopurine, vindesine, prednisone for the period of 2–2.5 years or HLA-haplotype-matched transplant [23]. The details about the therapies are displayed in Table S1. All subjects received central nervous system prophylaxis with intrathecal methotrexate and/or cytarabine for ≥ 8 doses during induction chemotherapy and consolidation therapy.

RNA extraction and synthesis of cellular DNA (cDNA)

Mononuclear cells were isolated from bone marrow samples by Ficoll-Hypaque density gradient centrifugation (Solarbio Technology, Beijing, China) at diagnosis and after completing the second course of consolidation. Total cellular RNA was extracted using Trizol® kits (Invitrogen, Carlsbad, CA, USA) according to the manufacturer’s instructions. Complementary DNA (cDNA) synthesis was done as described [24].

Measurement of relative CSRP2 transcript levels by qRT-PCR

Bone marrow samples at the end of the second course of consolidation therapy were analyzed by the relative transcript levels of CSRP2. TaqMan® quantification was done using the ABI PRISM® 7500 FAST Sequence Detection System (Applied Biosystems, Foster City, CA, USA) with ABL1 as an internal control. The primer and probe sequence of CSRP2 and ABL1 were designed using Primer-Express software (Applied Biosystems) and displayed in Table S2. qRT-PCR was done as described [24]. CSRP2 and ABL1 copy numbers were calculated as described in our previously published paper [21].

Immune phenotype, cytogenetic and molecular analyses

Bone marrow samples collected at diagnosis and after completing the second course of consolidation therapy were analyzed for leukemia-associated aberrant immune phenotypes (LAIPs) using standard eight-color MPFC. In most B-cell ALL cases, CD34-FITC/CD10-PE/CD45-perCP/CD19-APC and CD22-FITC/CD20PE/CD45-perCP/CD19-APC or CD58-FITC/CD123-PE/ and CD45-perCP/CD19-APC antibody combinations were sufficient to identify leukemic cells. A different-from-normal approach was used when a LAIP could not be assigned. A positive MPFC MRD-testing is defined as > 0.01% [25–27]. Cytogenetic analyses were done by G-banding [28]. WT1 and BCR::ABL1 transcripts and KMT2A fusion genes (KMT2A-AF4, KMT2A-AF9, KMT2A-AF1p, and KMT2A-AF1q) fusion transcripts were detected by TaqMan-based quantitative real-time polymerase chain reaction (qRT-PCR) as described [29]. The BCR::ABL1 transcripts were analyzed by qRT-PCR with a sensitivity of 10E-6. IKZF1 deletions were detected using multiplex qRT-PCR, multiplex fluorescent PCR, and sequence analysis [30].

Ethical statement

The study was approved by the Ethics Committee of Peking University People’s Hospital and all subjects have signed written informed consent consistent with the principles of the Helsinki Declaration. This trial has been registered in the Beijing Municipal Health Bureau Registration N 2007-1007 and in the Chinese Clinical Trial Registry [ChiCTR-OCH-10000940 and ChiCTR-OPC-14005546].

Statistical analysis

CIR was calculated as the interval from completing the second consolidation course to relapse, last follow-up, or withdrawal of consent. Cumulative incidences were estimated for relapse to accommodate competing risks. Relapse-free survival (RFS) was calculated from the completion of the second consolidation course to relapse, last follow-up, or withdrawal of consent. Overall survival (OS) was calculated as the interval from completing the second consolidation course to death, last follow-up, or withdrawal of consent. The threshold value to divide CSRP2 transcript levels into high and low cohorts was determined by the receiver operating characteristic (ROC) curve based on CIR data. Student’s t-test and Mann–Whitney U tests were used to analyze normal continuous variables and non-normal continuous variables. Pearson chi-square or Fisher exact tests were used to evaluate categorical co-variates. The Bonferroni procedure was used to perform multiple comparisons. Survival functions were estimated by the Kaplan–Meier method and compared by the log-rank test. A Cox proportional hazard regression model was used to determine correlations among MRD defined by CSRP2 transcript level, RFS, and OS. A competing risk model was used to determine associations between CSRP2 transcript levels and CIR. Co-variates with P < 0.20 in univariable analyses were included in multivariable analysis. P < 0.05 in a 2-sided test was considered statistically significant. Analyses were performed by SAS version 9.4 (SAS Institute Inc., Cary, NC, USA), Graphpad PrismTM 9.0.0 (San Diego, California, USA), and R software package (version 4.0.3; http://www.r-project.org). A negative BCR::ABL1 at the end of the second course of consolidation therapy was defined as an individual ≥ 3 log reduction from the BCR::ABL1 transcript level at diagnosis [31].

Results

Subject- and disease-related co-variates and outcomes

We studied 204 consecutive subjects who achieved a hematological complete remission after 1 (N ═ 192) or 2 (N ═ 12) courses of induction chemotherapy and remained in remission after 2 courses of consolidation therapy. In a preliminary analysis, there were no statistically significant differences in CIR, RFS, or OS between subjects requiring one or two induction chemotherapy courses to achieve a hematological complete remission and these cohorts were combined in subsequent analyses. The median follow-up of survivors was 31 months (interquartile range [IQR] 17–56 months). The median age of subjects was 34 years (IQR 24–46 years), and 111 were male. A total of 159 subjects (78%) received allotransplant, with a median of 3 months (IQR 2–4 months) after completing the second consolidation course. Forty-five others received maintenance chemotherapy only. Seventy subjects had a hematological relapse. The median interval from completing the second consolidation course to relapse was 13 months (IQR 5–25 months). Fifty-five subjects (27%) died of relapse (N ═ 39) or transplant-related mortality (N ═ 16). Details are displayed in Table 1.

Table 1: Subject- and leukemia-related co-variates
Variables Total, N ═ 204 Low CSRP2, N ═ 172 High CSRP2, N ═ 32 P value
Male, N (%) 111 (54) 91 (53) 20 (63) 0.42
Age (years)1 0.20
 Median (range) 34 (15–69) 34 (15–69) 36 (16–59)
Hemoglobin (g/L)1 0.47
 Median (range) 93 (29–164) 93 (29–160) 87 (50–164)
WBC1 ≥ 30×10E+9/L, N (%) 71 (35) 53 (31) 18 (56) 0.01
Platelets (×10E+9/L)1 0.20
 Median (range) 59 (3–352) 61 (3–352) 48 (5–311)
Bone marrow blasts1 (%) 0.80
 Median (range) 88 (16–99) 89 (16–99) 87 (55–98)
Immune phenotype1, N (%) 0.45
 Common 155 (76) 131 (76) 24 (75)
 Pre-B 22 (11) 20 (12) 2 (6)
 Pro-B 27 (13) 21 (12) 6 (19)
Cytogenetics1, N (%)
 Normal 67 (33) 59 (34) 8 (25) 0.30
 t(9;22)(q34;q11) 66 (32) 56 (33) 10 (31) 0.88
 t(1;19)(q23;p13) 5 5 0
 Hyperdiploid 2 2 0
 Hypodiploid 1 1 0
 KMT2A rearrangement2 8 (4) 4 (2) 4 (13) 0.03
 BCR::ABL12 positive 32 (16) 25 (15) 7 (22) 0.43
 IKZF1 deletion2 19 (9) 15 (9) 4 (13) 0.73
 MPFC-MRD2 positive 57 (28) 40 (23) 17 (53) 0.001
Post-consolidation therapy, N (%) 0.11
 Transplant 159 (78) 138 (80) 21 (65.6)
 Chemotherapy maintenance 45 (22) 34 (20) 11 (34)

1Detected at diagnosis: 2Detected at the end of the second course of consolidation therapy; MPFC-MRD: Multi-parameter flow cytometry measurable residual disease; CSRP2: Cysteine and glycine-rich protein 2; WBC: White blood count.

Serial determinations of CSRP2 transcript levels

We studied serial determinations of CSRP2 transcript levels in bone marrow samples from eight subjects at diagnosis, in complete hematological remission, and at relapse. CSRP2 transcript levels in complete hematological remission were significantly lower compared with diagnosis or relapse samples (Figure 2A). In 3 subjects with long-term follow-up, we compared the results of CSRP2 testing with other MRD assays, including MPFC (N ═ 3), WT1 and BCR::ABL1 transcript levels (N ═ 1), and IKZF1 deletion (N ═ 1; Figures 2B2D). CSRP2 transcript levels correlated well with clinical courses, as well as with other evaluated assays.

Figure 2.: Correlation of CSRP2 transcript levels with clinical course and other MRD-tests. (A) Correlation between CSRP2 transcript level and clinical course in eight subjects at diagnosis, in complete hematological remission and at relapse; (B–D) Dynamic CSRP2 transcript levels in three subjects with long-term follow-up; (E and F) CSRP2 transcript levels with MPFC-MRD and BCR::ABL1 at the end of the second course of consolidation therapy. BM blasts: Bone marrow blasts; CSRP2: Cysteine and glycine-rich protein 2; MRD: Measurable residual disease; MPFC: Multi-parameter flow cytometry.

CSRP2 transcript levels after consolidation

Subjects were divided into high (N ═ 32) and low (N ═ 172) cohorts based on a CSRP2 transcript at the end of the second course of consolidation therapy ≥ or < 0.93 percent of ABL1 transcript value determined by ROC curve based on CIR data. Clinical and laboratory co-variates were similar between cohorts except for white blood count (WBC) at diagnosis and MPFC-testing positivity or KMT2A rearrangement at the end of the second course of consolidation therapy (which was scored as MRD-positive; all P values < 0.05; Table 1).

CSRP2 transcript levels were analyzed for correlations with results of MPFC- and BCR::ABL1-testing. The MPFC testing was positive in 17 subjects (53%) in the high CSRP2 transcript cohort vs 40 (23%; P ═ 0.001) in the low CSRP2 transcript cohort. BCR::ABL1 transcripts were detected in 7 subjects (22%) in the high CSRP2 transcript cohort vs 15 (15%; P ═ 0.43) in the low CSRP2 transcript cohort. One hundred and thirty-two (132/172, 77%) subjects were negative for MRD by MPFC-testing in the low CSRP2 transcript cohort and 17 (17/32, 53%) were positive for MRD by MPFC-testing in the high CSRP2 transcript cohort with a concordance of 73% (r ═ 0.82; P < 0.001; Figure 2E). In the high CSRP2 transcript cohort, 2 of 12 subjects who were BCR::ABL1-positive at diagnosis became negative at the end of the second course of consolidation therapy compared with 26 of 74 in the low CSRP2 transcript cohort. Concordance for MRD-testing between BCR::ABL1 and CSRP2 transcripts was 65% (r ═ 0.98; P < 0.001; Figure 2F).

Twenty subjects (63%) in the high CSRP2 transcript level cohort relapsed compared with 50 (29%) in the low CSRP2 transcript level cohort (P ═ 0.001). We found that subjects with high CSRP2 transcript level had a higher CIR, worse RFS, and OS compared with those with low CSRP2 transcript levels. The 5-year CIRs were 65% (95% confidence interval [CI] 44%, 80%) vs 36% (95% CI 28%, 45%) in the high vs low CSRP2 transcript level cohorts (hazard ratio [HR] ═ 3.10 [95% CI 1.76, 5.45]; P < 0.001; Figure 3A). The 5-year RFS rates were 28% (95% CI 11%, 48%) vs 62% (95% CI 52%, 70%; HR ═ 3.50 [95% CI 1.62, 7.58]; P < 0.001); Figure 3B). The 5-year OS was 31% (95% CI 14%, 49%) vs 73% (95% CI 64%, 81%); HR ═ 4.36 (95% CI 1.91, 9.96); P < 0.001; Figure 3C).

Figure 3.: Outcomes in subjects based on CSRP2 cohort and MPFC-testing result. CIR (A), RFS (B), and OS (C) were compared between subjects with high or low CSRP2 transcript levels; CIR (D), RFS (E), and OS (F) of subjects in cohort-1 (MPFC-positive/high CSRP2 transcripts), cohort-2 (MPFC-positive/low CSRP2 transcripts), cohort-3 (MPFC-negative/high CSRP2 transcripts), and cohort-4 (MPFC-negative/low CSRP2 transcripts). MPFC combined with CSRP2 transcript level at the end of the second course of consolidation therapy better stratified patients and multiple comparisons based on the Bonferroni procedure were performed (CIR, all P > 0.05, cohort-1 vs cohort-2, P ═ 0.02, cohort-1 vs cohort-4, P < 0.001; RFS, all P > 0.05, cohort-1 vs cohort-2, P ═ 0.02, cohort-1 vs cohort-4, P < 0.001, cohort-3 vs cohort-4, P ═ 0.01; OS, all P < 0.05, cohort-1 vs cohort-3, P ═ 1.00, cohort-2 vs cohort-4, P ═ 1.00). CON2: The second course of consolidation therapy; CSRP2: Cysteine and glycine-rich protein 2; MPFC: Multi-parameter flow cytometry; CIR: Cumulative incidence of relapse; RFS: Relapse-free survival; OS: Overall survival.

In multivariable analyses, WBC ≥ 30×10E+9/L at diagnosis (HR ═ 1.82 [95% CI 1.05, 3.17]; P ═ 0.03), high CSRP2 transcript level (HR ═ 2.57 [95% CI 1.38, 4.76]; P ═ 0.003), maintenance chemotherapy vs transplant (HR ═ 5.56 [95% CI 3.23, 10.00]; P < 0.001), KMT2A rearrangement at the end of the second course of consolidation therapy (HR ═ 3.10 [95% CI 1.19, 8.07], P ═ 0.02), and a positive MPFC-testing (HR ═ 1.96 [95% CI 1.17, 3.29]; P ═ 0.01) were independently associated with higher 5-year CIR. These covariates were also significantly associated with worse 5-year RFS (HR 1.74 [95% CI 1.05, 2.90], P ═ 0.03; HR ═ 3.22 [95% CI 1.75, 5.93], P < 0.001; HR ═ 5.56 [95% CI 3.33, 10.00], P < 0.001; HR ═ 2.76 [95% CI 1.21, 6.33], P ═ 0.02; and HR ═ 1.74 [95% CI 1.05, 2.90], P ═ 0.04; respectively). Only high CSRP2 transcript levels at the end of the second consolidation course and post-consolidation maintenance chemotherapy were associated with worse OS (HR ═ 4.59 [95% CI 2.64, 7.99], P < 0.001; HR ═ 2.13 [95% CI 1.19, 3.70], P ═ 0.01; Table 2).

To determine whether combining data from results of MPFC testing and CSRP2 transcript levels improves CIR prediction accuracy, we divided subjects into 4 cohorts: (1) MPFC-positive/high CSRP2 transcripts (N ═ 17); (2) MPFC-positive/low CSPR2 transcripts (N ═ 40); (3) MPFC-negative/high CSRP2 transcripts (N ═ 15); and (4) MPFC-negative/low CSRP2 transcripts (N ═ 132). The combined test had good value for predicting CIR (71% [95% CI 41%, 87%] vs 44% [95% CI 25%, 63%] vs 57% [95% CI 23%, 80%] vs 34% [95% CI 25%, 43%]; P < 0.001; Figure 3D). Similar trends were detected for RFS (RFS, 29% [95% CI 11%, 51%] vs 54% [95% CI 33%, 71%] vs 22% [95% CI 1%, 58%] vs 64% [95% CI 53%, 73%], P < 0.001; Figure 3E). In addition, OS also showed similar trend as CIR and RFS (OS, 41% [95% CI: 16%, 64%] vs 72% [95% CI 50%, 86%] vs 25% [95% CI 7%, 49%] vs 73% [95% CI 62%, 81%], P < 0.001; Figure 3F).

Table 2: Multivariable analyses of 5-year CIR, RFS, and OS
Outcomes HR (95% CI) P value
CIR
WBC1 (≥ 30 vs < 30×10E+9/L) 1.82 (1.05, 3.17) 0.03
CSRP22 (high vs low) 2.57 (1.38, 4.76) 0.003
Chemotherapy maintenance 5.56 (3.23, 10.00) <0.001
KMT2A rearrangement2 (positive vs negative) 3.10 (1.19, 8.07) 0.02
MPFC-MRD2 (positive vs negative) 1.96 (1.17, 3.29) 0.01
RFS
WBC1 (≥ 30 vs < 30×10E+9/L) 1.74 (1.05, 2.90) 0.03
CSRP22 (high vs low) 3.22 (1.75, 5.93) <0.001
Chemotherapy maintenance 5.56 (3.33, 10.00) <0.001
KMT2A rearrangement2 (positive vs negative) 2.76 (1.21, 6.33) 0.02
MPFC-MRD2 (positive vs negative) 1.74 (1.05, 2.90) 0.04
OS
CSRP22 (high vs low) 4.59 (2.64, 7.99) <0.001
Chemotherapy maintenance 2.13 (1.19, 3.70) 0.01

1Detected at diagnosis: 2Detected at the end of the second course of consolidation therapy; CIR: Cumulative incidence of relapse; RFS: Relapse-free survival; OS: Overall survival; HR: Hazard ratio; CI: Confidence interval; MPFC-MRD: Multi-parameter flow cytometry-measurable residual disease; CSRP2: Cysteine and glycine-rich protein 2; WBC: White blood count.

CSRP2 transcript levels and outcomes in MPFC-MRD-negative patients

In addition, we analyzed 147 subjects with a negative MPFC testing. More than half (8/15, 53%) of the MPFC-negative/high CSRP2 group experienced recurrence. On the other hand, in the MPFC-negative/low CSRP2 group (N ═ 132), the relapse rate was relatively low (36/132, 27%). The 5-year CIR of the high CSRP2 transcript cohort was 57% (95% CI 23%, 80%) compared with 34% (95% CI 25%, 43%) in the low CSRP2 transcript cohort (HR ═ 2.38 [95% CI 1.04, 5.45]; P ═ 0.05; Figure 4A). The 5-year RFSs were 22% (95% CI 1%, 58%) vs 64% (95% CI 53%, 73%); (HR ═ 3.31 [95% CI 0.98, 11.15]; P ═ 0.001; Figure 4B). The 5-year OSs were 25% (95% CI 7%, 49%) vs 73% (95% CI 62%, 81%); (HR ═ 4.87 [95% CI 1.48, 16.03]; P < 0.001; Figure 4C). In multivariable analyses, high CSRP2 transcript level, chemotherapy maintenance rather than a transplant, and positive KMT2A rearrangement, all at the end of the second course of consolidation therapy were significantly correlated with higher CIR (HR ═ 2.70 [95% CI 1.19, 6.12], P ═ 0.02; HR ═ 2.94 [95% CI 1.52, 5.56], P ═ 0.002; HR ═ 7.16 [95% CI 3.88, 13.19], P < 0.001, respectively) and worse RFS (HR ═ 4.37 [95% CI 1.94, 9.85], P < 0.001; HR ═ 3.13 [95% CI 1.61, 5.88], P ═ 0.001; HR ═ 6.60 [95% CI 2.69, 16.17], P < 0.001, respectively). Only a high CSRP2 transcript level was significantly associated with worse OS (HR ═ 4.90 [95% CI 2.43, 9.90], P < 0.001; Table 3).

Figure 4.: Outcomes of CSRP2 transcript levels in negative MPFC-MRD subjects at the end of the second course of consolidation therapy. Cumulative incidence of relapse (A), relapse-free survival (B), and overall survival (C) were compared between subjects with high or low CSRP2 transcript levels. CON2: The second course of consolidation therapy; MPFC-MRD: Multi-parameter flow cytometry measurable residual disease; CSRP2: Cysteine and glycine-rich protein 2.
Figure 5.: Correlations between outcomes and post-consolidation therapy and CSRP2 transcript levels. (A) Cumulative incidence of relapse; (B) Relapse-free survival; (C) Overall survival. CON2: The second course of consolidation therapy; CSRP2: Cysteine and glycine-rich protein 2.

Impact of CSRP2 on outcomes in the transplant and chemotherapy cohorts

Forty-one transplant recipients (26%) and 29 maintenance chemotherapy recipients (64%) relapsed (P < 0.001). Next, we stratified subjects by post-consolidation therapy into 4 cohorts: (1) transplant/high CSRP2 transcript level (N ═ 21); (2) transplant/low CSRP2 transcript level (N ═ 138); (3) chemotherapy/high CSRP2 transcript level (N ═ 11); (4) chemotherapy/low CSRP2 transcript level (N ═ 34). These cohorts had significantly different CIRs of 52% ([95% CI 26%, 72%], 29% [95% CI 20%, 38%], 91% [95% CI 29%, 99%], and 63% [95% CI 42%, 79%], respectively; P < 0.001; Figure 5A). The 5-year RFS differed (41% [95% CI 16%, 65%] vs 69% [95% CI 58%, 76%] vs 9% [95% CI 1%, 42%] vs 37% [95% CI 19%, 54%]; P < 0.001; Figure 5B). In addition, 5-year OS also differed (38% [95% CI 15%, 60%] vs 75% [95% CI 64%, 83%] vs 20% [95% CI 3%, 47%] vs 67% [95% CI 45%, 82%]; P < 0.001; Figure 5C).

Table 3: Multivariable analyses of 5-year CIR, RFS, and OS in MPFC-negative subjects
Outcomes HR (95% CI) P value
CIR
CSRP21 (high vs low) 2.70 (1.19, 6.12) 0.02
Chemotherapy maintenance 2.94 (1.52, 5.56) 0.002
KMT2A rearrangement2(positive vs negative) 7.16 (3.88, 13.19) <0.001
RFS
CSRP21 (high vs low) 4.37 (1.94, 9.85) <0.001
Chemotherapy maintenance 3.13 (1.61, 5.88) 0.001
KMT2A rearrangement1 (positive vs negative) 6.60 (2.69, 16.17) <0.001
OS
CSRP21 (high vs low) 4.90 (2.43, 9.90) <0.001

1Detected at the end of the second course of consolidation therapy. CIR: Cumulative incidence of relapse; RFS: Relapse-free survival; OS: Overall survival; HR: Hazard ratio; CI: Confidence interval; MPFC: Multi-parameter flow cytometry; CSRP2: Cysteine and glycine-rich protein 2.

Discussion

Our data indicate that CSRP2 transcript levels, after the second course of consolidation therapy, are independently associated with 5-year CIR, RFS, and OS in adults with B-cell ALL receiving maintenance chemotherapy or an allotransplant. Providing data of CSRP2 transcript levels, in addition to results of MPFC-testing for MRD, improved relapse and survival prediction accuracy.

Included subjects with B-cell ALL were relatively young, with a median age of 34 years (IQR, 24–46 years), which probably reflected the transplant-related selection bias. The young age distribution may also explain the relatively few subjects with the BCR::ABL1 fusion gene.

There are several reasons why high CSRP2 level expression, after completing the second course of consolidation therapy, might correlate with an increased CIR. One is the indication of more residual leukemia cells compared with subjects with low CSRP2 expression. The second possibility relates to the mechanism of action of CSRP2 which favors cell proliferation, promotes cell-cycle progression, and inhibits apoptosis [18–21]. These explanations are not mutually exclusive.

There are several important limitations to our study. First, it is a retrospective study. Second, sample size is relatively small and there was no external validation cohort to test the threshold value of CSRP2 transcript level. Third, our comparator MRD evaluation was MPFC rather than a molecular method, such as IGH rearrangement by NGS. Fourth, the relatively few subjects with BCR::ABL1 fusion genes limited the power of our analyses. Fifth, the assignment to post-consolidation therapy was not random. These limitations require further validation of our conclusions in larger prospective studies.

Conclusion

In summary, our data indicate that providing data about CSPR2 transcript level, in addition to the results of MPFC MRD-testing at the end of conventional therapy, improves relapse and survival prediction accuracy in adults with B-cell ALL regardless of subsequent therapy.

Supplemental Data

Table S1: Details of therapy used for the treatment of subjects with acute lymphoblastic leukemia
Therapy Dose and schedules
CODP
Cyclophosphamide 750 mg/mE+2, day 1
Vindesine 4 mg, days 1, 8, 15 and 22
Daunorubicin 40–45 mg/mE+2, days 1 to 3
Prednisone 1 mg/kg/day
CODP + L
Cyclophosphamide 750 mg/mE+2, day 1
Vindesine 4 mg, days 1, 8, 15 and 22
Daunorubicin 40–45 mg/mE+2, days 1 to 3
Prednisone 1 mg/kg/day
L-asparaginase 10,000 U - days 15 to 24 / 3,750 U on day 15
VP
Vindesine 1.4 mg/mE+2, weekly
Prednisone 1 mg/kg/day
Hyper-CVAD (A)
Cyclophosphamide 300 mg/mE+2, once every 12 h, day 1 to 3
Vindesine 4 mg, days 4 and 11
Epirubicin 60 mg /mE+2, day 4
Dexamethasone 40 mg, days 1 to 4, and 11 to 14
Methotrexate 1–1.5 g/mE+2/day, day 1
Asparaginase 3,750 U on day 3
Hyper-CVA (B) (modified)
Methotrexate 1 g/mE+2, day 1
Cytosine arabinoside 1 g/mE+2, once every 12 h, days 2 to 3
FLAG
Fludarabine 25 mg/mE+2, days 1 to 5
Cytarabine 1 g/mE+2, days1 to 5
Granulocyte colony- stimulating factor (G-CSF) 5 µg/kg, days 1 to 5
CAM
Cyclophosphamide 1 g/mE+2/d, day 1
Cytarabine 100 mg/mE+2/d, days 1 to 7
6-mercaptopurine 50 mg/mE+2/d, days 1 to 7
Methotrexate and asparginase
Methotrexate 1–1.5 g/mE+2/d, day 1
Asparaginase 3,750 U on day 3
Maintenance chemotherapy
Methotrexate 20 mg/mE+2, weekly
6-mercaptopurine 60 mg/mE+2, days 1 to 28
Vindesine 4 mg, day 1
Prednisone 1 mg/kg, days 1 to 7
Table S2: Primer and probe sequences of CSRP2 and ABL1
Primer or probe Sequence (5-’3’)
CSRP2 forward primer GTGATGGCAGGAGCTTCCA
CSRP2 reverse primer GCCACTGTTGTGCTATCTAAATTTTT
CSRP2 probe FAM-CGCTGCTGCTTTCTCTGCATGGTTT-BHQ
ABL1 forward primer CCGCTGACCATCAATAAGGAA
ABL1 reverse primer GATGTAGTTGCTTGGGACCCA
ABL1 probe FAM-CCATTTTTGGTTTGGGCTTCACACCATT-TAMARA

CSRP2: Cysteine and glycine-rich protein 2.

Acknowledgements

We thank colleagues at the Institute of Hematology, Peking University for help in obtaining samples.

References

  1. , , , , , (). Minimal residual disease after induction is the strongest predictor of prognosis in intermediate risk relapsed acute lymphoblastic leukaemia—long-term results of trial ALL-REZ BFM P95/96. Eur J Cancer. https://doi.org/10.1016/j.ejca.2012.11.010
  2. , , , , , (). Postinduction minimal residual disease monitoring by polymerase chain reaction in children with acute lymphoblastic leukemia. J Clin Oncol. https://doi.org/10.1200/JCO.2014.56.0698
  3. , , , , , (). Early MRD response as a prognostic factor in adult patients with acute lymphoblastic leukemia. Eur J Haematol. https://doi.org/10.1111/ejh.12587
  4. , , , , , (). Association of minimal residual disease with clinical outcome in pediatric and adult acute lymphoblastic leukemia: a meta-analysis. JAMA Oncol. https://doi.org/10.1001/jamaoncol.2017.0580
  5. , (). How good are we at predicting the fate of someone with acute myeloid leukaemia?. Leukemia. https://doi.org/10.1038/leu.2017.56
  6. , , , , (). Measurable residual disease testing in acute myeloid leukaemia. Leukemia. https://doi.org/10.1038/leu.2017.113
  7. , , (). Refining AML outcome prediction. Leukemia. https://doi.org/10.1038/s41375-018-0317-4
  8. , , , , , (). High-sensitivity next-generation sequencing MRD assessment in ALL identifies patients at very low risk of relapse. Blood Adv. https://doi.org/10.1182/bloodadvances.2022007378
  9. , , , , , (). Immunophenotypic modulation of the blast cells in childhood acute lymphoblastic leukemia minimal residual disease detection. Folia Med (Plovdiv). https://doi.org/10.1515/folmed-2016-0004
  10. (). Minimal residual disease in acute lymphoblastic leukemia: technical aspects and implications for clinical interpretation. Blood Res. https://doi.org/10.5045/br.2020.S004
  11. , , , , , (). Minimal residual disease in acute lymphoblastic leukemia: current practice and future directions. Cancers (Basel). https://doi.org/10.3390/cancers13081847
  12. , , , , , (). Minimal residual disease detection in childhood acute lymphoblastic leukaemia patients at multiple time-points reveals high levels of concordance between molecular and immunophenotypic approaches. Br J Haematol. https://doi.org/10.1111/j.1365-2141.2008.07429.x
  13. , , , , , (). Analysis of minimal residual disease in childhood acute lymphoblastic leukemia: comparison between RQ-PCR analysis of Ig/TcR gene rearrangements and multicolor flow cytometric immunophenotyping. Leukemia. https://doi.org/10.1038/sj.leu.2403444
  14. , , , , , (). Comparative analysis of flow cytometry and polymerase chain reaction for the detection of minimal residual disease in childhood acute lymphoblastic leukemia. Leukemia. https://doi.org/10.1038/sj.leu.2403348
  15. , , , (). Cloning, structural analysis, and chromosomal localization of the human CSRP2 gene encoding the LIM domain protein CRP2. Genomics. https://doi.org/10.1006/geno.1997.4855
  16. , , , , (). The cysteine-rich protein family of highly related LIM domain proteins. J Biol Chem. https://doi.org/10.1074/jbc.270.48.28946
  17. , , , (). Structure of cysteine- and glycine-rich protein CRP2. backbone dynamics reveal motional freedom and independent spatial orientation of the lim domains. J Biol Chem. https://doi.org/10.1074/jbc.273.36.23233
  18. , , , , , (). CRP2, a new invadopodia actin bundling factor critically promotes breast cancer cell invasion and metastasis. Oncotarget. https://doi.org/10.18632/oncotarget.7327
  19. , , , , , (). Hypoxia promotes breast cancer cell invasion through HIF-1alpha-mediated up-regulation of the invadopodial actin bundling protein CSRP2. Sci Rep. https://doi.org/10.1038/s41598-018-28637-x
  20. , , , , , (). Cysteine and glycine-rich protein 2 promotes hypoxic pulmonary vascular smooth muscle cell proliferation through the Wnt3alpha-beta-catenin/lymphoid enhancer-binding factor 1 pathway. J Biochem Mol Toxicol. https://doi.org/10.1002/jbt.23122
  21. , , , , , (). Cysteine and glycine-rich protein 2 (CSRP2) transcript levels correlate with leukemia relapse and leukemia-free survival in adults with B-cell acute lymphoblastic leukemia and normal cytogenetics. Oncotarget. https://doi.org/10.18632/oncotarget.16416
  22. , , , , , (). The 2016 revision to the World Health Organization classification of myeloid neoplasms and acute leukemia. Blood. https://doi.org/10.1182/blood-2016-03-643544
  23. , , , , , (). Allogeneic stem cell transplantation vs tyrosine kinase inhibitors combined with chemotherapy in patients with Philadelphia chromosome-positive acute lymphoblastic leukemia. Biol Blood Marrow Transplant. https://doi.org/10.1016/j.bbmt.2017.12.777
  24. , , , , , (). Abnormal expression of the programmed cell death 5 gene in acute and chronic myeloid leukemia. Leuk Res. https://doi.org/10.1016/j.leukres.2005.12.028
  25. , , , , , (). CD38+ CD58- is an independent adverse prognostic factor in paediatric Philadelphia chromosome negative B cell acute lymphoblastic leukaemia patients. Leuk Res. https://doi.org/10.1016/j.leukres.2015.12.015
  26. , , , , , (). The prognostic role of E2A-PBX1 expression detected by real-time quantitative reverse transcriptase polymerase chain reaction (RQ-PCR) in B cell acute lymphoblastic leukemia after allogeneic hematopoietic stem cell transplantation. Ann Hematol. https://doi.org/10.1007/s00277-018-3338-1
  27. , , , , , (). Minimal residual disease status determined by multiparametric flow cytometry pretransplantation predicts the outcome of patients with ALL receiving unmanipulated haploidentical allografts. Am J Hematol. https://doi.org/10.1002/ajh.25417
  28. , , , , , (). Standardized fluorescence in situ hybridization testing based on an appropriate panel of probes more effectively identifies common cytogenetic abnormalities in myelodysplastic syndromes than conventional cytogenetic analysis: a multicenter prospective study of 2302 patients in China. Leuk Res. https://doi.org/10.1016/j.leukres.2015.02.005
  29. , , , , , (). The prognostic significance of Wilms’ tumor gene 1 (WT1) expression at diagnosis in adults with Ph-negative B cell precursor acute lymphoblastic leukemia. Ann Hematol. https://doi.org/10.1007/s00277-019-03789-6
  30. , , , , , (). Prognostic impact of IKZF1 deletion in adults with common B-cell acute lymphoblastic leukemia. BMC Cancer. https://doi.org/10.1186/s12885-016-2300-7
  31. , , , , , (). Philadelphia chromosome-positive acute lymphoblastic leukemia: to allogeneic stem cell transplantation or not? a single center experience. Blood. https://doi.org/10.1182/blood.V128.22.2308.2308

Conflicts of interest: RPG is a consultant to Antengene Biotech LLC, Ascentage Pharm Group, Nanexa Pharma and NexImmune Inc, Medical Director of FFF Enterprises Inc.; Partner in AZAC Inc.; Board of Directors of Russian Foundation for Cancer Research Support and Scientific Advisory Board: StemRad Ltd. Other authors declare no conflicts of interest.

Funding: Supported by grants from the National Natural Science Foundation of China [Grant 82100169], National Natural Science Foundation of China [Grant 81770156], National Natural Science Foundation of China [Grant 81930004], Innovative Research Groups of the National Natural Science Foundation of China [Grant 81621001], and the Beijing Municipal Natural Science Foundation [Grant 7192213].

Data availability: The data that support the findings of this study are available from the corresponding authors upon reasonable request.