

Identification and validation of TUBB, CLTA, and FBXL5 as potential diagnostic markers of postmenopausal osteoporosis
Abstract
Postmenopausal osteoporosis (PMOP) is recognized as the most prevalent bone disease worldwide. N6-methyladenosine (m6A) is one of the most common RNA modifications influencing the progression of various disorders; however, its specific role in PMOP remains unexplored. This study aims to investigate the expression profiles of m6A-related genes and their impact on the prognosis of PMOP patients. We utilized the GSE56815 expression analysis dataset obtained from the Gene Expression Omnibus (GEO) database and extracted m6A-related genes for further examination. Our analysis revealed that m6A-related genes exhibited differential expression between PMOP patients and healthy controls. We employed consensus clustering to identify subgroups within the PMOP cohort and conducted immunological analyses on these clusters. Additionally, we intersected the clusters to identify differentially expressed genes (DEGs) and analyzed potential diagnostic markers for PMOP using support vector machine recursive feature elimination (SVM-RFE), LASSO, and random forest (RF) algorithms, which were subsequently validated in the GSE56116 dataset. The receiver operating characteristic (ROC) curve was employed to assess the diagnostic significance of these markers. Furthermore, quantitative PCR (qPCR) was performed to validate the expression of the identified genes. In the GSE56815 dataset, we identified three subtypes associated with m6A modifications, leading to the identification of 302 shared DEGs among these subtypes. Gene ontology (GO) analysis indicated that the DEGs were predominantly enriched in nuclear specks, the nuclear envelope, and nucleocytoplasmic transport processes. Kyoto Encyclopedia of Genes and Genomes (KEGG) enrichment analysis further revealed that DEGs were primarily associated with endocytosis and nucleocytoplasmic transport pathways. Through the application of SVM, LASSO, and RF algorithms, we identified three potential diagnostic markers: TUBB, CLTA, and FBXL5, which demonstrated promising diagnostic capabilities when tested against an independent dataset. qPCR validation confirmed significant expression differences of these genes between the control and PMOP groups. The genetic markers identified in this study hold potential for accurately predicting the risk of PMOP in patients. The findings contribute to understanding the underlying molecular mechanisms of CLTA, TUBB, and FBXL5 in PMOP and may facilitate the development of novel therapeutic strategies and improved monitoring of the disease.
Keywords
m6A postmenopausal osteoporosis PMOP m6A methylation diagnostic biomarkers unsupervised clusteringFull text
Introduction
Postmenopausal osteoporosis (PMOP) is a prevalent metabolic bone disease that primarily affects postmenopausal women. Due to decreasing estrogen levels and increased bone resorption, menopause causes the destruction of bone microstructure and a reduction in bone mass, as well as increased brittleness [1]. Secondary osteoporotic fractures raise the social burden by increasing disability and mortality, especially psychologically and economically. It is a challenge for the healthcare system to address osteoporosis due to its various complications and the high personal and social costs, particularly as the majority of affected individuals do not receive treatment. This lack of health initiatives is evident in nearly 60% of affected individuals who are at high risk for osteoporotic fractures and do not receive bone protective therapy [2]. Currently, PMOP treatment primarily relies on bisphosphonates, selective estrogen receptor modulators (SERMs), calcitonin, RANKL inhibitors, parathyroid hormone analogues, and Wnt pathway agonists [3]. Nevertheless, these therapies still face obstacles regarding adherence, safety, and personalized efficacy, while current diagnostic approaches (e.g., DXA) have poor sensitivity and cannot accurately predict fracture risk. Thus, it is necessary to identify more precise molecular markers for the early diagnosis and personalized treatment of PMOP.
The most prevalent RNA methylation is N6-methyladenine (m6A) [4], which occurs in the conserved RRACH motif (R ═ G or A; H ═ A, C, or U) [5] and is concentrated close to the stop codon of mRNAs [6]. Notably, m6A modification enzymes have been identified as enzyme technology has progressed. The major m6A methyltransferases are the methyltransferase-like protein, methyltransferase, and Wilms tumor-associated protein complex, while fat and obesity-related protein (FTO) and α-ketoglutarate-dependent [7, 8] dioxygenase base B homolog (ALKBH5) are the main demethylases. Presently, among RNA modifications, m6A has become a research hotspot [9]. The aforementioned modification performs various regulatory roles in post-transcription, such as transcriptional regulation, alternative splicing, stabilization, and translation, by binding to YTH domain-containing proteins [10]. Additionally, m6A modification regulates cellular biological functions, including cell differentiation, embryo development, and disease incidence. Bones perform a vital role in providing support and protection to the body; although these are just a few of the many other functions performed, including enabling movement, blood production, and acting as a reservoir for various minerals such as calcium. A variety of epigenetic modifications influence the expression of genes in bone cells through various regulatory mechanisms, thereby affecting the precise processes of remodeling and development of bones. These mechanisms include histone modification, along with DNA and RNA methylation [11]. Prior research has indicated a significant effect on the activity and function of bone cells due to the disruption of epigenetic processes, which could potentially lead to the development of bone-related disorders [10, 11].
Based on the Integrated Gene Expression Omnibus (GEO) database, consensus clustering was used to determine the clustering of m6A-DEGs, and the Least Absolute Contraction and Selection Operator (LASSO) algorithm [12], support vector machine-recursive feature elimination (SVM-RFE) algorithm [13], and random forest (RF) algorithm [14] were used to determine the diagnostic markers. The three most representative genes, TUBB, CLTA, and FBXL5, were verified in GSE56116 [15]. Moreover, we explored the probable molecular underpinnings of osteoporosis, ultimately benefiting the disease’s early detection, therapy, and prevention.
Materials and methods
Data retrieval
GEO datasets were utilized to acquire patient information (GSE56815) [16]. GSE56815 contains 80 samples, including 40 postmenopausal osteoporosis samples and 40 premenopausal samples. The m6A regulators that were removed included nine writers, 15 readers, and two erasers.
m6A-DEGs in PMOP
The GSE56815 dataset underwent stringent data pre-processing operations to achieve comparability and reproducibility in this study. First, the raw expression data were processed by quantile normalization and log2 conversion to remove technical noise and optimize the data distribution. Second, we corrected the data with ComBat (sva R package) to eliminate batch effects and checked for batch effects with PCA to enable comparability between different datasets. Then, the limma (v3.58.1) software package was used to screen differentially expressed genes (DEGs), with a screening criterion of a Benjamini–Hochberg false discovery rate (FDR) adjusted P value of less than 0.05. The specific markers TUBB, CLTA, and FBXL5 were validated in other datasets via cross-validation to provide robustness and reliability.
Construction of m6A clusters based on m6A-associated genes
Various m6A clusters were built considering the expression of m6A-associated genes, while unsupervised clustering methods were performed to categorize patients into discrete classifications. The use of the consensus clustering technique ensured the quantity and stability of the clustering process, and the “ConsensusClusterPlus” (v1.66.0) software was used to assess the classification’s stability.
Inference of microenvironment and immune cells
The immune cell infiltration characteristics of the PMOP group and control group were evaluated through single-sample gene set enrichment analysis (ssGSEA). Reference was made to the MSigDB and xCell immune cell marker gene sets, which included 24 types of immune cells, and the ssGSEA score was calculated using the GSVA (v1.50.5) R package. We used Z-score normalization to compare the differences in each observation within samples and Wilcoxon rank-sum tests for the assessment of group differences, and we performed Spearman correlation analysis to evaluate the correlation between core genes and immune cells. The results dissected the immune microenvironment in the PMOP group and investigated the potential function of TUBB, CLTA, and FBXL5 in immune regulation.
Identification of m6A gene expression between different patterns
In order to better study the pathway of enrichment in degree, we chose three intersecting genes, A-B, B-C, and A-C, for Kyoto Encyclopedia of Genes and Genomes (KEGG) pathway analysis and gene ontology (GO) biological method using a P value less than 0.05, a minimum count of 5, and an enrichment factor larger than 0.15. By installing the clusterProfiler (v4.10.1) R package, gene set enrichment analysis (GSEA) was utilized to analyze the subtype-associated activities of all genes considering their log2 fold change.
| Gene names | Forward primer | Reverse primer |
|---|---|---|
| TUBB | TCCATGAAGGAGGTCGATGA | CAGACGGCTGTCTTGACATT |
| CLTA | CCGCCATGGCTGAGTTAGA | GGCTCTTCAGTGCACCAG |
| FBXL5 | GGCAGATTTTAGAGCTTTGTCCTA | CGAAGACTCTGGCAGCAACCAA |
| GAPDH | GGAGTCCACTGGTGTCTTCA | GGGAACTGAGCAATTGGTGG |
Acquisition of diagnostic markers
A detailed study of the efficacy of the major biomarkers was conducted through algorithm screening. Three types of intersection genes, A-B, B-C, and C-A, were selected for algorithm screening, including minimum absolute contraction and selection operator (LASSO) logistic regression, SVM-RFE, and RandomForest (RF) [14, 17, 18]. These algorithms were utilized to identify the relevant PMOP-associated genes. The precise and efficient diagnostic biomarkers were detected through the intersection of the screened PMOP-related feature genes, and further analysis was performed.
Screening and verification of diagnostic markers
The degree of accuracy regarding the predictive capability of the aforementioned diagnostic markers for patients with varying risk outcomes was examined by deriving the area under the curve (AUC) of the receiver operating characteristics (ROC), where an increased AUC value denotes an increased accuracy of the constructed gene signature. The box diagram of expression differences of core genes was drawn to examine the variation in the expression of the diagnostic markers between postmenopausal and premenopausal samples. We then obtained the gene for further verification in another dataset (GSE56116). The PerformanceAnalytics R package was employed to conduct a heat map analysis of gene correlation for the hub genes to analyze whether there is a correlation between the diagnostic markers and whether a correlation exists between their expression levels. The number cex = 0.7 was considered to be the correlation coefficient.
To construct a nomogram model of postmenopausal osteoporosis and premenopausal classification
The “rms” (v6.8-1) software creates the nomogram model with consideration of the chosen explanatory variables. Based on the qualities of each variable for the patient, we project upwards on a tiny scale to determine the value of each item (point). The sum is derived from each item’s score. The greater the overall value, the greater the PMOP probability. The curves for calibration, decision curve analysis (DCA), and clinical effect were analyzed to confirm the model’s correctness. A 1000-resampling method was used for internal validation of the model.
Single sample gene set enrichment analysis and correlation heat map of hub genes
Single sample gene set enrichment analysis (GSEA) was executed on the diagnostic markers screened through LASSO, SVM, and RF to analyze the corresponding functions of high and low expression of each hub gene. KEGG analysis was performed, and the first five and the last five GSEA results were selected and displayed together after ranking the analysis results.
Quantitative real-time polymerase chain reaction (qRT-PCR)
This study collected ten peripheral blood samples, including five samples from healthy patients and five samples from PMOP. This study has been approved by the Medical Ethics Committee of Nantong University Affiliated Hospital. Samples were collected and used according to approved guidelines. Total RNA was extracted using the TRIzol method. Quantitative reverse transcription-polymerase chain reaction (qRT-PCR) was performed on RNA (2 µg) extracted from each sample on a LightCycler 480 PCR system (Roche, USA) using FastStart Universal SYBR Green Master. cDNA was used as a template in a 20 µL reaction volume (2 µL cDNA template, 10 µL PCR mixture, 0.5 µL forward and reverse primers, and an appropriate amount of water). The PCR reaction was performed using the following procedure: cycling conditions started with an initial DNA denaturation phase at 95∘C for 30 s, followed by 45 cycles at 94∘C for 15 s, 56∘C for 30 s, and 72∘C for 20 s. Three separate analyses were performed for each sample. Threshold cycle (CT) data were obtained based on the 2-ΔΔCT method and normalized to GAPDH levels for each sample. It was confirmed that the melting curve was checked to ensure single amplicon specificity. The sequence list of primer pairs for target genes is shown in Table 1.
Statistical analysis
The relationships between the genes (part of the gene signature) and the immune-associated cells were analyzed, and the characteristic gene expression in the case group was compared with that of the normal group for a more detailed investigation. The former correlation was determined using Spearman’s rank correlation coefficient, whereas the latter process was evaluated through the Wilcoxon signed-rank test. The AUC of the ROC curve was measured using the timeROC (v 0.4) package to examine the accuracy of the predictive ability of genes associated with PMOP for the probability of belonging to the PMOP group. The prediction ability was associated with the AUC values, wherein the general predictive value was set in the range of AUC > 0.60, while a value of AUC > 0.70 was set as a good predictive value. The R-4.0.3 software was utilized for statistical analysis in this research. A P value < 0.05 was considered statistically significant.
Results
m6A-DEGs in PMOP
Firstly, six m6A-related DEGs were identified between the control groups and PMOP groups. Further, we drew the expression heatmap of six m6A DEGs (Figure 1A) and found that the expressions of WTAP, ZC3H13, RBM15, YTHDC1, and FMR1 in the PMOP group were higher than those in the control group (P < 0.01). In the control group, RBM15B expression was greater than that in the PMOP group. The chromosomal positions of the m6A-DEGs were plotted on a loop graph (Figure 1B).
Consensus clustering of m6A genes among three clusters
The m6A-related genes were categorized according to their varying expression levels into different clusters. The crossover among PMOP samples was detected to be minimal when the consensus matrix K value was at 3 (Figure 2A). The expression of six m6A regulators in the clusters was studied, and the associated boxplots were plotted (Figure 2B). The resulting plots depicted the increased expression of WTAP in Cluster A compared to that in other clusters (P < 0.01). The expression level of RBM15B in Cluster B was elevated compared to the other clusters (P < 0.01), while the expressions of ZC3H13, RBM15, YTHDC1, and FMR1 in Cluster C were at a higher level than those in other clusters (P < 0.01). Additionally, the three distinct patterns of distribution of PCA lend credence (Figure 2C) to the classification generated by consensus clustering analysis. Increasing data show that osteoporosis advancement is strongly associated with the immune milieu, leading to the notion that the immune microenvironment can play a role in postmenopausal osteoporosis progression. Therefore, the variation in the infiltration status of lymphocytes was investigated. As shown in the figure (Figure 2D), immune cell infiltration landscapes across the three groups were significantly different. Immune cell infiltration analysis of the bone microenvironment showed that the m6A B cluster was significantly correlated with CD56 dim cells, immature dendritic cells, macrophages, and monocytes in peripheral blood. m6A C was significantly associated with immature B cell monocytes.
Immune microenvironment of the three clusters
The immune microenvironment analysis of the six m6A regulators showed that the expression of FMR1 is high in immature B cells but low in immature dendritic cells and macrophages (Figure 3A). RBM15 was expressed at a high level in gamma delta T cells and immature B cells, while it was expressed at a low level in CD56dim natural killer cells (Figure 3B). RBM15B was underexpressed in activated CD8 T cells and activated B cells (Figure 3C). The expression of WTAP in the immunological microenvironment was not substantially different (Figure 3D). The immature YTHDC1 has enhanced expression in immature B cells (Figure 3E). ZC3H13 is highly expressed in mast cells (Figure 3F).
DEGs identification and functional annotation
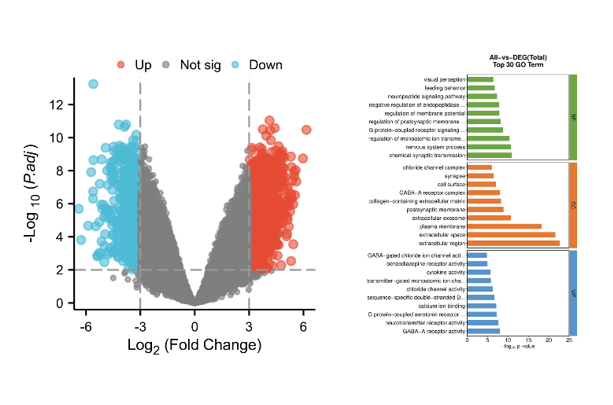
To explore the potential biological differences of the m6A cluster, we obtained 302 shared genes among three subgroups: Cluster A, Cluster B, and Cluster C (Figure 4). In addition, we performed GO and KEGG analyses on the 302 DEGs. The GO analysis of the biological mechanisms depicted enrichment of intersection genes in nuclear transport, protein localization to the nucleus, and nucleocytoplasmic transport. The cytological analysis of the aforementioned genes depicted their abundance in nuclear specks and the nuclear envelope, whereas their increased presence in transcription coregulator activity was exhibited through analyzing molecular biological functions (Figure 5A). The KEGG analysis of the biological mechanisms depicted nucleocytoplasmic transport (Figure 5B).
Screening and verification of diagnostic markers
We utilized the LASSO algorithm to identify the major 12 biomarkers out of a total of 302 cross-genes (Figure 6A). The major biomarkers from the cross-genes were detected by means of the SVM-RFE algorithm and were found to be 168 genes (Figure 6B). The RF algorithm was used to screen 19 key biomarkers from 302 cross-genes (Figure 6C). After that, we intersected the genes obtained by the three algorithms to obtain the three diagnostic markers TUBB, CLTA, and FBXL5 (Figure 6D). The ROC curve of TUBB, CLTA, and FBXL5 showed that they could be used as valuable biomarkers. The AUC value of TUBB was 0.724 (Figure 7A), that of CLTA was 0.736 (Figure 7B), and that of FBXL5 was 0.752 (Figure 7C), indicating that these three diagnostic markers had high prediction accuracy. Differential expression analysis of these three genes exhibited that the levels of expression of TUBB (Figure 7D) and CLTA (Figure 7E) in the samples of normal patients were higher than those of PMOP patients, whereas the results were vice versa for FBXL5 (Figure 7F). In order to further verify the accuracy of these three genes, ROC curve verification was performed in another dataset (GSE56116). The AUC value of TUBB was 0.778 (Figure 7G), that of CLTA was 0.778 (Figure 7H), and that of FBXL5 was 0.889 (Figure 7I). Furthermore, we validated these three genes using clinical samples, and the results showed that the expression of TUBB and CLTA was significantly higher in the control group than in PMOP. On the contrary, the expression of FBXL5 in PMOP was significantly higher than that in normal samples (Figure 7J).
To construct a nomogram model of postmenopausal osteoporosis and premenopausal classification
Using these diagnostic markers, we constructed a nomogram to predict PMOP (Figure 8A). By scoring the above features, the higher the total score, the greater the probability of PMOP occurring. Through the calibration curve, we observed a strong agreement between the predicted and actual probabilities of the nomogram (Figure 8B). DCA revealed that although both the nomogram model and a single diagnostic marker created a net profit, the one from the nomogram model was much higher (Figure 8C). Consequently, nomogram models can be more clinically useful than individual diagnostic indicators. The examination of the clinical influence curve demonstrates that the nomogram model possesses good diagnostic accuracy (Figure 8D).
Analysis of GSEA
The GSEA analysis was executed for these three key biomarkers, and the results recorded for TUBB showed that high expression of TUBB may affect 2-oxocarboxylic acid metabolism and the pentose phosphate pathway. Low expression is affected by protein export as well as pentose and basal transcription factors (Figure 9A).
CLTA showed that high expression of CLTA may affect the pentose phosphate pathway and fructose and mannose metabolism. Low expression affects steroid biosynthesis and nucleocytoplasmic transport (Figure 9B). The GSEA analysis of FBXL5 showed that high expression of FBXL5 may affect protein export, basal transcription factors, and ribosome biogenesis in eukaryotes. Low expression of the gene is affected by fructose and mannose metabolism and 2-oxocarboxylic acid metabolism (Figure 9C).
Discussion
The prevalence of osteoporosis is particularly high in postmenopausal women of older age, thereby placing these women at risk of fractures. Regarding this age range, the increasing morbidity and mortality linked with hip and spinal fractures have been somewhat worrying. The main purpose of osteoporosis treatment is to stop bones from fracturing through various means such as slowing or blocking bone loss, maintaining bone strength, and reducing or eliminating causes of fractures [19].
In eukaryotes, the major epigenetic modification that performs various functions in biological processes is the N6-methyladenosine (m6A) modification, which is involved in the biological onset and progression of various diseases. Accumulating data suggest that m6A modification plays a dominant role in bone development and osteoporosis metabolism as a novel epigenetic transcriptome marker [20, 21]. Currently, data from many experiments have illustrated the role of m6A modifications in osteoporosis by linking various molecular mechanisms involved in this disease to m6A modifications. Chen et al. [22] found that the osteogenic differentiation of mesenchymal stem cells (MSCs) was enhanced through m6A demethylation mediated by FTO in the 3’ UTR of PPARG mRNA. Peng et al. [23] found that osteogenesis could be promoted through the m6A methylation of LINC00657 mediated by METTL3. Li et al. [24] identified six novel PMOP-related genes using genome-wide association and transcriptome prediction models. The role of bone metabolism, the bone marrow microenvironment, and the immune system is crucial. As such, future research should integrate GWAS, transcriptomics, and m6A methylation data to further investigate the precise role of m6A in the regulation of PMOP-associated genes in order to elucidate a more precise PMOP molecular regulatory network and provide new targets for personalized therapy. Wu et al. [25] showed that the m6A methyltransferase METTL3 in bone marrow MSCs (BMMSCs) could induce osteoporosis in mice, and overexpression of METTL3 protected mice from estrogen deficiency-induced osteoporosis. Therefore, searching for distinct diagnostic markers, analyzing the infiltration pattern of PMOP immune cells, mining the database related to PMOP to find more characteristic genes, providing new ideas for the treatment and prevention of PMOP, and promoting the prognosis of PMOP cases are of great significance.
The three different PMOP subtypes were identified in this research. PMOP cluster B was considerably associated with basic transcription factors and peripheral blood CD56 dim cells, immature dendritic cells, macrophages, and monocytes. In the PMOP C cluster, immature B cells were significantly associated. The association between genes constructing the genetic signatures and immune cells was examined. The analysis indicated a significant association of FMR1 with immature B cells, immature dendritic cells, and macrophages. RBM15 was significantly associated with gamma delta T cells, immature B cells, and CD56 dim natural killer cells. RBM15B was significantly associated with activated CD8 T cells and activated B cells. YTHDC1 is significantly associated with immature B cells. ZC3H13 is significantly associated with mast cells. A large body of literature has studied the relationship between immune cells and bone. Macrophages can affect the formation of osteocytes through paracrine signaling or direct cell-to-cell contact and can also secrete reactive oxygen species (ROS) and inflammatory cytokines (IL-1β, IL-6, TNF-α) to influence the formation of osteoclasts [26]. Mast cells themselves contain many osteoclast mediators, including IL-6 and TNF-α. Kroner et al. showed that stimulated mast cell supernatant induced osteoclast genesis when estrogen was absent [27, 28].
Several experiments have indicated that the lack of estrogen is an important factor that affects the formation of postmenopausal osteoporosis. In a physiological state, estrogen utilizes various signaling pathways to protect osteoblasts from apoptosis, enhance the proliferation, maturation, and ossification of osteoblasts, and maintain the formation of bone [29, 30]. The decrease in estrogen levels in postmenopausal women eliminates this protective effect on bone, promotes osteoclast generation and bone resorption, and inhibits apoptosis of osteoclasts through various processes [29, 31]. Manolagas et al. pointed out that the loss of estrogen reduces the defense against oxidative stress in bone and unbalances the REDOX reaction. This excessive increase in ROS leads to the excessive proliferation of osteoclasts, resulting in a gradual decline in the volume and density of bone tissue [32]. The role of estrogen in the formation of osteoporosis through its effect on the immune system has been well established in many studies. Estrogen can inhibit osteoclast formation by down-regulating T lymphocytes and other inflammatory cytokines. Estrogen deficiency increases T cell activity, upregulates some inflammatory cytokines (IL-1β, IL-6, TNF-α), increases the expression of NF-κB Ligand (RANKL), and stimulates osteoclast production and bone resorption [33, 34]. Under conditions of estrogen deficiency, B lymphocytes regulate the production of osteoclasts by secreting RANKL, while neutrophils become overactivated, leading to osteoblast apoptosis and increased osteoclast production by releasing ROS [28]. Because our knowledge of the relationship between the immune system, estrogen, and osteoporosis is incomplete, further study is required. A potentially beneficial strategy to treat PMOP would be to target the immune system. In addition, the intersection genes of these three different PMOP isoforms were analyzed by GO enrichment analysis, and the results indicated a significant association of the 302 PMOP central genes with biological processes such as macrophage autophagy and protein dephosphorylation. Osteoporosis is characterized by reduced bone mass and significant adipose tissue accumulation within the bone marrow environment. Autophagy is extremely important in the elimination of dysfunctional or unnecessary organelles and proteins [35].
Recent research has shown that m6A modification plays a vital role in the regulation of autophagy and adipogenesis [36]. Qi et al. [37] found that autophagy affects the development of PMOP by regulating endogenous BMMSCs. Jiao et al. [38] found that m6A modification could inhibit adipocyte differentiation. Singh et al. [39] found that autophagy regulates fat accumulation and lipogenesis. Recent studies have shown that dephosphorylation not only plays a crucial role in the control of osteogenesis and adipogenesis [40] but is also involved in the regulation of chondrocytes [41]. Aging or other pathological stimuli affect the imbalance of protein phosphorylation, which contributes to bone marrow obesity and progressive bone loss, leading to the development of osteoporosis [40].
In this study, LASSO, RF, and SVM-RFE algorithms were performed using previously obtained 302 central genes. Three hub genes related to PMOP were identified from the intersection of genes obtained by these three algorithms. Later, to identify the three characteristic genes, CLTA, TUBB, and FBXL5, the ROC curve was used for analysis, and the results indicated that the gene marker under study had excellent predictive ability. At present, no relevant studies have investigated the mechanism between CLTA and PMOP. Huang et al. found that CLTA was linked with rheumatoid arthritis [42]. They discovered that CCAAT/enhancer binding protein β (C/EPPβ) combined with CLTA was involved in FAO metabolism, which caused osteoclast overgeneration and bone destruction. At the same time, many studies have confirmed that the FAO metabolic mechanism is involved in osteoclast metabolism [43, 44], and it can be assumed that CLTA may also affect PMOP by similarly causing bone loss. The mechanism of this interaction needs to be further studied. TUBB is one of the components that form microtubules. Previous studies have shown that microtubules affect bone resorption through their effects on the actin cytoskeleton of osteoclasts [45, 46]. The relationship between microtubules and the actin cytoskeleton is physiological and functional [46]. The actin cytoskeleton and microtubules are required for the development of foot processes and osteoclast bone resorption [47]. Kodama [48] pointed out that microtubules mediate the formation of podosomes by microfilaments and affect the differentiation and maturation of osteoclasts.
At present, the mechanism of action between TUBB and PMOP is not yet known, although it is believed that TUBB may also affect the generation of osteoclasts by regulating osteoclast activity, thus leading to OP. Iron is an important substance in human cell metabolism. Numerous investigations conducted recently have revealed a clear association between abnormal iron metabolism and osteoporosis [49]. Postmenopausal women experience an accumulation of iron along with estrogen deficiency. According to Chen et al., increased iron levels are a risk factor for PMOP in postmenopausal women [50]. A disorder of iron metabolism affects bone homeostasis [51]. In addition to promoting osteoclast differentiation and osteoblast death, excess iron decreases osteoblast proliferation and differentiation [50]. Several studies have indicated a close correlation of FBXL5 with iron metabolism, and FBXL5 can affect cellular iron metabolism by mediating iron regulatory protein 1 (IRP1) and iron regulatory protein 2 (IRP2) [51, 52]. According to Liu et al., iron buildup controls osteoblast apoptosis through the lncRNA XIST/Mir-758-3p/caspase 3 axis, leading to osteoporosis [53]. Although the direct mechanism of FBXL5 and PMOP has not been studied, we believe that FBXL5 is likely to cause osteoporosis by affecting iron metabolism.
Despite this, there are still some limitations in this study, which systematically analyzed the GEO public database and confirmed that TUBB, CLTA, and FBXL5 could be identified as potential diagnostic markers of PMOP using ML algorithms. First of all, this study is mostly based on bioinformatics data mining, and further experimental validation of the biological functions of these markers in PMOP progression is warranted. Second, the heterogeneity of the samples may affect the universality of the analysis results because the data are obtained from public databases. Therefore, to further prove the reliability and application value of this study, future studies should confirm the specific mechanisms of TUBB, CLTA, and FBXL5 in PMOP development via cell experiments, animal models, and clinical samples, and evaluate their utility value with respect to clinical diagnosis and treatment.
Conclusion
This study has identified and validated that TUBB, CLTA, and FBXL5 could serve as potential diagnostic markers for PMOP and has shown their utility in early screening, personalized risk assessment, and targeted therapy. These genes can serve as non-invasive blood tests to increase the early diagnosis rate of PMOP and be potential therapeutic targets for iron metabolism regulation, microtubule stability, and immune intervention. Future work should integrate clinical validation, multi-omics analysis, and novel molecular intervention strategies to facilitate the precise diagnosis and treatment of PMOP and offer patients more effective prevention and treatment measures.
References
- Baccaro LF, Conde DM, Costa-Paiva L, Pinto-Neto AM. The epidemiology and management of postmenopausal osteoporosis: a viewpoint from Brazil. Clin Intervent Aging 2015;10:583–91. https://doi.org/10.2147/CIA.S54614
- Hernlund E, Svedbom A, Ivergård M, Compston J, Cooper C, Stenmark J, et al. A report prepared in collaboration with the international osteoporosis foundation (IOF) and the European federation of pharmaceutical industry associations (EFPIA). Arch Osteopor 2013;8(1):136. https://doi.org/10.1007/s11657-013-0136-1
- Zhu C, Zhang Y, Pan Y, Zhang Z, Liu Y, Lin X, et al. Clinical correlation between intestinal flora profiles and the incidence of postmenopausal osteoporosis. Gynecol Endocrinol 2025;41(1):2465587. https://doi.org/10.1080/09513590.2025.2465587
- Luo J, Xu T, Sun K. N6-methyladenosine RNA modification in inflammation: roles, mechanisms, and applications. Front Cell Develop Biol 2021;9:670711. https://doi.org/10.3389/fcell.2021.670711
- Roundtree IA, He C. RNA epigenetics–chemical messages for posttranscriptional gene regulation. Curr Opin Chem Biol 2016;30:46–51. https://doi.org/10.1016/j.cbpa.2015.10.024
- Huang H, Weng H, Zhou K, Wu T, Zhao BS, Sun M. Histone H3 trimethylation at lysine 36 guides m(6)A RNA modification co-transcriptionally. Nature 2019;567(7748):414–419. https://doi.org/10.1038/s41586-019-1016-7
- Tao L, Mu X, Chen H, Jin D, Zhang R, Zhao Y, et al. FTO modifies the m6A level of MALAT and promotes bladder cancer progression. Clin Transl Med 2021;11(2):e310. https://doi.org/10.1002/ctm2.310
- Zhang L, Wan Y, Zhang Z, Jiang Y, Lang J, Cheng W, et al. FTO demethylates m6A modifications in HOXB13 mRNA and promotes endometrial cancer metastasis by activating the WNT signalling pathway. RNA Biol 2021;18(9):1265–78. https://doi.org/10.1080/15476286.2020.1841458
- Huang M, Xu S, Liu L, Zhang M, Guo J, Yuan Y, et al. m6A methylation regulates osteoblastic differentiation and bone remodeling. Front Cell Develop Biol 2021;9:783322. https://doi.org/10.3389/fcell.2021.783322
- Chen X, Hua W, Huang X, Chen Y, Zhang J, Li G. Regulatory role of RNA N(6)-methyladenosine modification in bone biology and osteoporosis. Front Endocrinol 2019;10:911. https://doi.org/10.3389/fendo.2019.00911
- Sun Z, Wang H, Wang Y, Yuan G, Yu X, Jiang H, et al. MiR-103-3p targets the m(6) a methyltransferase METTL14 to inhibit osteoblastic bone formation. Aging Cell 2021;20(2):e13298. https://doi.org/10.1111/acel.13298
- Jiang Y, Wang Y, Zhang J, Xie B, Liao J, Liao W. Outlier detection and robust variable selection via the penalized weighted LAD-LASSO method. J Appl Stat 2021;48(2):234–46. https://doi.org/10.1080/02664763.2020.1722079
- Huang S, Cai N, Pacheco PP, Narrandes S, Wang Y, Xu W. Applications of support vector machine (SVM) learning in cancer genomics. Cancer Genom Proteom 2018;15(1):41–51. https://doi.org/10.21873/cgp.20063
- Strobl C, Boulesteix AL, Zeileis A, Hothorn T. Bias in random forest variable importance measures: illustrations, sources and a solution. BMC Bioinf 2007;8:25. https://doi.org/10.1186/1471-2105-8-25
- Dong Q, Han Z, Tian L. Identification of serum exosome-derived circRNA-miRNA-TF-mRNA regulatory network in postmenopausal osteoporosis using bioinformatics analysis and validation in peripheral blood-derived mononuclear cells. Front Endocrinol 2022;13:899503. https://doi.org/10.3389/fendo.2022.899503
- Yang C, Ren J, Li B, Jin C, Ma C, Cheng C, et al. Identification of gene biomarkers in patients with postmenopausal osteoporosis. Mol Med Rep 2019;19(2):1065–73. https://doi.org/10.3892/mmr.2018.9752
- Tibshirani R. The lasso method for variable selection in the cox model. Stat Med 1997;16(4):385–95. https://doi.org/10.1002/(SICI)1097-0258(19970228)16:4∖textless{}385::AID-SIM380∖textgreater{}3.0.CO;2-3
- Guyon I, Weston J, Barnhill S, Vapnik V. Gene selection for cancer classification using support vector machines. Mach Learn 2002;46(1):389–422. https://doi.org/10.1023/A:1012487302797
- Hari Kumar KV, Muthukrishnan J, Verma A, Modi KD. Correlation between bone markers and bone mineral density in postmenopausal women with osteoporosis. Endocrine Pract 2008;14(9):1102–7. https://doi.org/10.4158/EP.14.9.1102
- Wang W, Qiao SC, Wu XB, Sun B, Yang JG, Li X, et al. Circ_0008542 in osteoblast exosomes promotes osteoclast-induced bone resorption through m6A methylation. Cell Death Dis 2021;12(7):628. https://doi.org/10.4158/EP.14.9.1102
- Tian C, Huang Y, Li Q, Feng Z, Xu Q. Mettl3 regulates osteogenic differentiation and alternative splicing of vegfa in bone marrow mesenchymal stem cells. Int J Mol Sci 2019;20(3):551. https://doi.org/10.3390/ijms20030551
- Chen LS, Zhang M, Chen P, Xiong XF, Liu PQ, Wang HB, et al. The m(6)A demethylase FTO promotes the osteogenesis of mesenchymal stem cells by downregulating PPARG. Acta Pharmacol Sinica 2022;43(5):1311–23. https://doi.org/10.1038/s41401-021-00756-8
- Peng J, Zhan Y, Zong Y. METTL3-mediated LINC00657 promotes osteogenic differentiation of mesenchymal stem cells via miR-144-3p/BMPR1B axis. Cell Tissue Res 2022;388(2):301–12. https://doi.org/10.1007/s00441-022-03588-y
- Li S, Chen B, Chen H, Hua Z, Shao Y, Yin H, et al. Analysis of potential genetic biomarkers and molecular mechanism of smoking-related postmenopausal osteoporosis using weighted gene co-expression network analysis and machine learning. PloS One 2021;16(9):e0257343. https://doi.org/10.1371/journal.pone.0257343
- Wu Y, Xie L, Wang M, Xiong Q, Guo Y, Liang Y, et al. Mettl3-mediated m(6)A RNA methylation regulates the fate of bone marrow mesenchymal stem cells and osteoporosis. Nat Commun 2018;9(1):4772. https://doi.org/10.1038/s41467-018-06898-4
- Genin M, Clement F, Fattaccioli A, Raes M, Michiels C. M1 and M2 macrophages derived from THP-1 cells differentially modulate the response of cancer cells to etoposide. BMC Cancer 2015;15:577. https://doi.org/10.1186/s12885-015-1546-9
- Kroner J, Kovtun A, Kemmler J, Messmann JJ, Strauss G, Seitz S, et al. Mast cells are critical regulators of bone fracture-induced inflammation and osteoclast formation and activity. J Bone Miner Res 2017;32(12):2431–44. https://doi.org/10.1002/jbmr.3234
- Fischer V, Haffner-Luntzer M. Interaction between bone and immune cells: Implications for postmenopausal osteoporosis. Semin Cell Develop Biol 2022;123:14–21. https://doi.org/10.1016/j.semcdb.2021.05.014
- Khosla S, Oursler MJ, Monroe DG. Estrogen and the skeleton. Trends Endocrinol Metab 2012;23(11):576–81. https://doi.org/10.1016/j.tem.2012.03.008
- Gavali S, Gupta MK, Daswani B, Wani MR, Sirdeshmukh R, Khatkhatay MI. Estrogen enhances human osteoblast survival and function via promotion of autophagy. Biochim Biophys Acta Mol Cell Res 2019;1866(9):1498–507. https://doi.org/10.1016/j.bbamcr.2019.06.014
- McNamara LM. Osteocytes and estrogen deficiency. Curr Osteoporos Rep 2021;19(6):592–603. https://doi.org/10.1007/s11914-021-00702-x
- Manolagas SC. From estrogen-centric to aging and oxidative stress: a revised perspective of the pathogenesis of osteoporosis. Endocr Rev 2010;31(3):266–300. https://doi.org/10.1210/er.2009-0024
- Cohen-Solal ME, Graulet AM, Denne MA, Gueris J, Baylink D, de Vernejoul MC. Peripheral monocyte culture supernatants of menopausal women can induce bone resorption: involvement of cytokines. J Clin Endocrinol Metab 1993;77(6):1648–53. https://doi.org/10.1210/jcem.77.6.8263153
- Lam J, Takeshita S, Barker JE, Kanagawa O, Ross FP, Teitelbaum SL. TNF-alpha induces osteoclastogenesis by direct stimulation of macrophages exposed to permissive levels of RANK ligand. J Clin Investig 2000;106(12):1481–8. https://doi.org/10.1172/JCI11176
- Levine B, Kroemer G. Biological functions of autophagy genes: a disease perspective. Cell 2019;176(1-2):11–42. https://doi.org/10.1016/j.cell.2018.09.048
- Wang X, Wu R, Liu Y, Zhao Y, Bi Z, Yao Y, et al. m(6)A mRNA methylation controls autophagy and adipogenesis by targeting Atg5 and Atg7. Autophagy 2020;16(7):1221–35. https://doi.org/10.1080/15548627.2019.1659617
- Qi M, Zhang L, Ma Y, Shuai Y, Li L, Luo K, et al. Autophagy maintains the function of bone marrow mesenchymal stem cells to prevent estrogen deficiency-induced osteoporosis. Theranostics 2017;7(18):4498–516. https://doi.org/10.7150/thno.17949
- Jiao Y, Zhang J, Lu L, Xu J, Qin L. The Fto gene regulates the proliferation and differentiation of pre-adipocytes in vitro. Nutrients 2016;8(2):102. https://doi.org/10.3390/nu8020102
- Singh R, Xiang Y, Wang Y, Baikati K, Cuervo AM, Luu YK, et al. Autophagy regulates adipose mass and differentiation in mice. J Clin Investig 2009;119(11):3329–39. https://doi.org/10.1172/JCI39228
- Yen YT, Chien M, Wu PY, Hung SC. PP2A in LepR+ mesenchymal stem cells contributes to embryonic and postnatal endochondral ossification through Runx2 dephosphorylation. Commun Biol 2021;4(1):658. https://doi.org/10.1038/s42003-021-02175-1
- Bai J, Zhang Y, Zheng X, Huang M, Cheng W, Shan H, et al. LncRNA MM2P-induced, exosome-mediated transfer of Sox9 from monocyte-derived cells modulates primary chondrocytes. Cell Death Dis 2020;11(9):763. https://doi.org/10.1038/s41419-020-02945-5
- Huang Z, Luo R, Yang L, Chen H, Zhang X, Han J, et al. CPT1A-mediated fatty acid oxidation promotes precursor osteoclast fusion in rheumatoid arthritis. Front Immunol 2022;13:838664. https://doi.org/10.3389/fimmu.2022.838664
- Kushwaha P, Wolfgang MJ, Riddle RC. Fatty acid metabolism by the osteoblast. Bone 2018;115:8–14. https://doi.org/10.1016/j.bone.2017.08.024
- Da W, Tao L, Zhu Y. The role of osteoclast energy metabolism in the occurrence and development of osteoporosis. Front Endocrinol 2021;12:675385. https://doi.org/10.3389/fendo.2021.675385
- Guérit D, Marie P, Morel A, Maurin J, Verollet C, Raynaud-Messina B, et al. Primary myeloid cell proteomics and transcriptomics: importance of β-tubulin isotypes for osteoclast function. J Cell Sci 2020;133(10):jcs239772. https://doi.org/10.1242/jcs.239772
- Matsubara T, Yaginuma T, Addison WN, Fujita Y, Watanabe K, Yoshioka I, et al. Plectin stabilizes microtubules during osteoclastic bone resorption by acting as a scaffold for Src and Pyk2. Bone 2020;132:115209. https://doi.org/10.1016/j.bone.2019.115209
- Okumura S, Mizoguchi T, Sato N, Yamaki M, Kobayashi Y, Yamauchi H, et al. Coordination of microtubules and the actin cytoskeleton is important in osteoclast function, but calcitonin disrupts sealing zones without affecting microtubule networks. Bone 2006;39(4):684–93. https://doi.org/10.1016/j.bone.2006.04.010
- Kodama J, Kaito T. Osteoclast multinucleation: review of current literature. Int J Mol Sci 2020;21(16):5685. https://doi.org/10.3390/ijms21165685
- Li GF, Pan YZ, Sirois P, Li K, Xu YJ. Iron homeostasis in osteoporosis and its clinical implications. Osteoporos Int 2012;23(10):2403–8. https://doi.org/10.1007/s00198-012-1982-1
- Balogh E, Tolnai E, Nagy B, Nagy B, Balla G, Balla J, et al. Iron overload inhibits osteogenic commitment and differentiation of mesenchymal stem cells via the induction of ferritin. Biochim Biophys Acta 2016;1862(9):1640–9. https://doi.org/10.1016/j.bbadis.2016.06.003
- Wang H, Shi H, Rajan M, Canarie ER, Hong S, Simoneschi D, et al. FBXL5 regulates IRP2 stability in iron homeostasis via an oxygen-responsive [2Fe2S] cluster. Mol Cell 2020;78(1):31–41.e35. https://doi.org/10.1016/j.molcel.2020.02.011
- Johnson NB, Deck KM, Nizzi CP. Eisenstein RS: a synergistic role of IRP1 and FBXL5 proteins in coordinating iron metabolism during cell proliferation. J Biol Chem 2017;292(38):15976–89. https://doi.org/10.1074/jbc.M117.785741
- Liu H, Wang YW, Chen WD, Dong HH, Xu YJ. Iron accumulation regulates osteoblast apoptosis through lncRNA XIST/miR-758-3p/caspase 3 axis leading to osteoporosis. IUBMB Life 2021;73(2):432–43. https://doi.org/10.1002/iub.2440
About this article
Correspondence
*Correspondence to Jianfeng Chen: [email protected]; Chenlin Zhang: [email protected] and Shiqi Ren: [email protected]
Notes
Yue Tan, Yujing Wang and Qin Zhu contributed equally to this work.
Associate Editor: Jibin Liu
Article history
Received: 2025-01-08 · Rev-recd: 2025-08-11 · Accepted: 2025-07-03
Conflicts of interest
Conflicts of interest: Authors declare no conflicts of interest.
Funding
Funding: This study was supported by the Foundation of Jiangsu CM Clinical Innovation Center of Degenerative Bone & Joint Disease (Jiangsu Science and Education of Traditional Chinese Medicine (2021) No. 4) and the Foundation of the Top Talent Support Program for young and middle-aged people of the Wuxi Health Committee [Grant Number HB2020068].
Copyright
© 2025 Tan et al.
Downloads
References
Baccaro LF, Conde DM, Costa-Paiva L, Pinto-Neto AM. The epidemiology and management of postmenopausal osteoporosis: a viewpoint from Brazil. Clin Intervent Aging. 2015;10:583-91. doi:10.2147/CIA.S54614 DOI: https://doi.org/10.2147/CIA.S54614
Hernlund E, Svedbom A, Ivergård M, Compston J, Cooper C, Stenmark J, et al. A report prepared in collaboration with the international osteoporosis foundation (IOF) and the European federation of pharmaceutical industry associations (EFPIA). Arch Osteopor. 2013;8(1):136. doi:10.1007/s11657-013-0136-1 DOI: https://doi.org/10.1007/s11657-013-0136-1
Zhu C, Zhang Y, Pan Y, Zhang Z, Liu Y, Lin X, et al. Clinical correlation between intestinal flora profiles and the incidence of postmenopausal osteoporosis. Gynecol Endocrinol. 2025;41(1):2465587. doi:10.1080/09513590.2025.2465587 DOI: https://doi.org/10.1080/09513590.2025.2465587
Luo J, Xu T, Sun K. N6-methyladenosine RNA modification in inflammation: roles, mechanisms, and applications. Front Cell Develop Biol. 2021;9:670711. doi:10.3389/fcell.2021.670711 DOI: https://doi.org/10.3389/fcell.2021.670711
Roundtree IA, He C. RNA epigenetics–chemical messages for posttranscriptional gene regulation. Curr Opin Chem Biol. 2016;30:46-51. doi:10.1016/j.cbpa.2015.10.024 DOI: https://doi.org/10.1016/j.cbpa.2015.10.024
Huang H, Weng H, Zhou K, Wu T, Zhao BS, Sun M. Histone H3 trimethylation at lysine 36 guides m(6)A RNA modification co-transcriptionally. Nature. 2019;567(7748):414-419. doi:10.1038/s41586-019-1016-7 DOI: https://doi.org/10.1038/s41586-019-1016-7
Tao L, Mu X, Chen H, Jin D, Zhang R, Zhao Y, et al. FTO modifies the m6A level of MALAT and promotes bladder cancer progression. Clin Transl Med. 2021;11(2):e310. doi:10.1002/ctm2.310 DOI: https://doi.org/10.1002/ctm2.310
Zhang L, Wan Y, Zhang Z, Jiang Y, Lang J, Cheng W, et al. FTO demethylates m6A modifications in HOXB13 mRNA and promotes endometrial cancer metastasis by activating the WNT signalling pathway. RNA Biol. 2021;18(9):1265-78. doi:10.1080/15476286.2020.1841458 DOI: https://doi.org/10.1080/15476286.2020.1841458
Huang M, Xu S, Liu L, Zhang M, Guo J, Yuan Y, et al. m6A methylation regulates osteoblastic differentiation and bone remodeling. Front Cell Develop Biol. 2021;9:783322. doi:10.3389/fcell.2021.783322 DOI: https://doi.org/10.3389/fcell.2021.783322
Chen X, Hua W, Huang X, Chen Y, Zhang J, Li G. Regulatory role of RNA N(6)-methyladenosine modification in bone biology and osteoporosis. Front Endocrinol. 2019;10:911. doi:10.3389/fendo.2019.00911 DOI: https://doi.org/10.3389/fendo.2019.00911
Sun Z, Wang H, Wang Y, Yuan G, Yu X, Jiang H, et al. MiR-103-3p targets the m(6) a methyltransferase METTL14 to inhibit osteoblastic bone formation. Aging Cell. 2021;20(2):e13298. doi:10.1111/acel.13298 DOI: https://doi.org/10.1111/acel.13298
Jiang Y, Wang Y, Zhang J, Xie B, Liao J, Liao W. Outlier detection and robust variable selection via the penalized weighted LAD-LASSO method. J Appl Stat. 2021;48(2):234-46. doi:10.1080/02664763.2020.1722079 DOI: https://doi.org/10.1080/02664763.2020.1722079
Huang S, Cai N, Pacheco PP, Narrandes S, Wang Y, Xu W. Applications of support vector machine (SVM) learning in cancer genomics. Cancer Genom Proteom. 2018;15(1):41-51. doi:10.21873/cgp.20063 DOI: https://doi.org/10.21873/cgp.20063
Strobl C, Boulesteix AL, Zeileis A, Hothorn T. Bias in random forest variable importance measures: illustrations, sources and a solution. BMC Bioinf. 2007;8:25. doi:10.1186/1471-2105-8-25 DOI: https://doi.org/10.1186/1471-2105-8-25
Dong Q, Han Z, Tian L. Identification of serum exosome-derived circRNA-miRNA-TF-mRNA regulatory network in postmenopausal osteoporosis using bioinformatics analysis and validation in peripheral blood-derived mononuclear cells. Front Endocrinol. 2022;13:899503. doi:10.3389/fendo.2022.899503 DOI: https://doi.org/10.3389/fendo.2022.899503
Yang C, Ren J, Li B, Jin C, Ma C, Cheng C, et al. Identification of gene biomarkers in patients with postmenopausal osteoporosis. Mol Med Rep. 2019;19(2):1065-73. doi:10.3892/mmr.2018.9752 DOI: https://doi.org/10.3892/mmr.2018.9752
Tibshirani R. The lasso method for variable selection in the cox model. Stat Med. 1997;16(4):385-95. doi:10.1002/(SICI)1097-0258(19970228)16:4∖textless{}385::AID-SIM380∖textgreater{}3.0.CO;2-3 DOI: https://doi.org/10.1002/(SICI)1097-0258(19970228)16:4<385::AID-SIM380>3.0.CO;2-3
Guyon I, Weston J, Barnhill S, Vapnik V. Gene selection for cancer classification using support vector machines. Mach Learn. 2002;46(1):389-422. doi:10.1023/A:1012487302797 DOI: https://doi.org/10.1023/A:1012487302797
Hari Kumar KV, Muthukrishnan J, Verma A, Modi KD. Correlation between bone markers and bone mineral density in postmenopausal women with osteoporosis. Endocrine Pract. 2008;14(9):1102-7. doi:10.4158/EP.14.9.1102 DOI: https://doi.org/10.4158/EP.14.9.1102
Wang W, Qiao SC, Wu XB, Sun B, Yang JG, Li X, et al. Circ_0008542 in osteoblast exosomes promotes osteoclast-induced bone resorption through m6A methylation. Cell Death Dis. 2021;12(7):628. doi:10.4158/EP.14.9.1102 DOI: https://doi.org/10.1038/s41419-021-03915-1
Tian C, Huang Y, Li Q, Feng Z, Xu Q. Mettl3 regulates osteogenic differentiation and alternative splicing of vegfa in bone marrow mesenchymal stem cells. Int J Mol Sci. 2019;20(3):551. doi:10.3390/ijms20030551 DOI: https://doi.org/10.3390/ijms20030551
Chen LS, Zhang M, Chen P, Xiong XF, Liu PQ, Wang HB, et al. The m(6)A demethylase FTO promotes the osteogenesis of mesenchymal stem cells by downregulating PPARG. Acta Pharmacol Sinica. 2022;43(5):1311-23. doi:10.1038/s41401-021-00756-8 DOI: https://doi.org/10.1038/s41401-021-00756-8
Peng J, Zhan Y, Zong Y. METTL3-mediated LINC00657 promotes osteogenic differentiation of mesenchymal stem cells via miR-144-3p/BMPR1B axis. Cell Tissue Res. 2022;388(2):301-12. doi:10.1007/s00441-022-03588-y DOI: https://doi.org/10.1007/s00441-022-03588-y
Li S, Chen B, Chen H, Hua Z, Shao Y, Yin H, et al. Analysis of potential genetic biomarkers and molecular mechanism of smoking-related postmenopausal osteoporosis using weighted gene co-expression network analysis and machine learning. PloS One. 2021;16(9):e0257343. doi:10.1371/journal.pone.0257343 DOI: https://doi.org/10.1371/journal.pone.0257343
Wu Y, Xie L, Wang M, Xiong Q, Guo Y, Liang Y, et al. Mettl3-mediated m(6)A RNA methylation regulates the fate of bone marrow mesenchymal stem cells and osteoporosis. Nat Commun. 2018;9(1):4772. doi:10.1038/s41467-018-06898-4 DOI: https://doi.org/10.1038/s41467-018-06898-4
Genin M, Clement F, Fattaccioli A, Raes M, Michiels C. M1 and M2 macrophages derived from THP-1 cells differentially modulate the response of cancer cells to etoposide. BMC Cancer. 2015;15:577. doi:10.1186/s12885-015-1546-9 DOI: https://doi.org/10.1186/s12885-015-1546-9
Kroner J, Kovtun A, Kemmler J, Messmann JJ, Strauss G, Seitz S, et al. Mast cells are critical regulators of bone fracture-induced inflammation and osteoclast formation and activity. J Bone Miner Res. 2017;32(12):2431-44. doi:10.1002/jbmr.3234 DOI: https://doi.org/10.1002/jbmr.3234
Fischer V, Haffner-Luntzer M. Interaction between bone and immune cells: Implications for postmenopausal osteoporosis. Semin Cell Develop Biol. 2022;123:14-21. doi:10.1016/j.semcdb.2021.05.014 DOI: https://doi.org/10.1016/j.semcdb.2021.05.014
Khosla S, Oursler MJ, Monroe DG. Estrogen and the skeleton. Trends Endocrinol Metab. 2012;23(11):576-81. doi:10.1016/j.tem.2012.03.008 DOI: https://doi.org/10.1016/j.tem.2012.03.008
Gavali S, Gupta MK, Daswani B, Wani MR, Sirdeshmukh R, Khatkhatay MI. Estrogen enhances human osteoblast survival and function via promotion of autophagy. Biochim Biophys Acta Mol Cell Res. 2019;1866(9):1498-507. doi:10.1016/j.bbamcr.2019.06.014 DOI: https://doi.org/10.1016/j.bbamcr.2019.06.014
McNamara LM. Osteocytes and estrogen deficiency. Curr Osteoporos Rep. 2021;19(6):592-603. doi:10.1007/s11914-021-00702-x DOI: https://doi.org/10.1007/s11914-021-00702-x
Manolagas SC. From estrogen-centric to aging and oxidative stress: a revised perspective of the pathogenesis of osteoporosis. Endocr Rev. 2010;31(3):266-300. doi:10.1210/er.2009-0024 DOI: https://doi.org/10.1210/er.2009-0024
Cohen-Solal ME, Graulet AM, Denne MA, Gueris J, Baylink D, de Vernejoul MC. Peripheral monocyte culture supernatants of menopausal women can induce bone resorption: involvement of cytokines. J Clin Endocrinol Metab. 1993;77(6):1648-53. doi:10.1210/jcem.77.6.8263153 DOI: https://doi.org/10.1210/jcem.77.6.8263153
Lam J, Takeshita S, Barker JE, Kanagawa O, Ross FP, Teitelbaum SL. TNF-alpha induces osteoclastogenesis by direct stimulation of macrophages exposed to permissive levels of RANK ligand. J Clin Investig. 2000;106(12):1481-8. doi:10.1172/JCI11176 DOI: https://doi.org/10.1172/JCI11176
Levine B, Kroemer G. Biological functions of autophagy genes: a disease perspective. Cell. 2019;176(1-2):11-42. doi:10.1016/j.cell.2018.09.048 DOI: https://doi.org/10.1016/j.cell.2018.09.048
Wang X, Wu R, Liu Y, Zhao Y, Bi Z, Yao Y, et al. m(6)A mRNA methylation controls autophagy and adipogenesis by targeting Atg5 and Atg7. Autophagy. 2020;16(7):1221-35. doi:10.1080/15548627.2019.1659617 DOI: https://doi.org/10.1080/15548627.2019.1659617
Qi M, Zhang L, Ma Y, Shuai Y, Li L, Luo K, et al. Autophagy maintains the function of bone marrow mesenchymal stem cells to prevent estrogen deficiency-induced osteoporosis. Theranostics. 2017;7(18):4498-516. doi:10.7150/thno.17949 DOI: https://doi.org/10.7150/thno.17949
Jiao Y, Zhang J, Lu L, Xu J, Qin L. The Fto gene regulates the proliferation and differentiation of pre-adipocytes in vitro. Nutrients. 2016;8(2):102. doi:10.3390/nu8020102 DOI: https://doi.org/10.3390/nu8020102
Singh R, Xiang Y, Wang Y, Baikati K, Cuervo AM, Luu YK, et al. Autophagy regulates adipose mass and differentiation in mice. J Clin Investig. 2009;119(11):3329-39. doi:10.1172/JCI39228 DOI: https://doi.org/10.1172/JCI39228
Yen YT, Chien M, Wu PY, Hung SC. PP2A in LepR+ mesenchymal stem cells contributes to embryonic and postnatal endochondral ossification through Runx2 dephosphorylation. Commun Biol. 2021;4(1):658. doi:10.1038/s42003-021-02175-1 DOI: https://doi.org/10.1038/s42003-021-02175-1
Bai J, Zhang Y, Zheng X, Huang M, Cheng W, Shan H, et al. LncRNA MM2P-induced, exosome-mediated transfer of Sox9 from monocyte-derived cells modulates primary chondrocytes. Cell Death Dis. 2020;11(9):763. doi:10.1038/s41419-020-02945-5 DOI: https://doi.org/10.1038/s41419-020-02945-5
Huang Z, Luo R, Yang L, Chen H, Zhang X, Han J, et al. CPT1A-mediated fatty acid oxidation promotes precursor osteoclast fusion in rheumatoid arthritis. Front Immunol. 2022;13:838664. doi:10.3389/fimmu.2022.838664 DOI: https://doi.org/10.3389/fimmu.2022.838664
Kushwaha P, Wolfgang MJ, Riddle RC. Fatty acid metabolism by the osteoblast. Bone. 2018;115:8-14. doi:10.1016/j.bone.2017.08.024 DOI: https://doi.org/10.1016/j.bone.2017.08.024
Da W, Tao L, Zhu Y. The role of osteoclast energy metabolism in the occurrence and development of osteoporosis. Front Endocrinol. 2021;12:675385. doi:10.3389/fendo.2021.675385 DOI: https://doi.org/10.3389/fendo.2021.675385
Guérit D, Marie P, Morel A, Maurin J, Verollet C, Raynaud-Messina B, et al. Primary myeloid cell proteomics and transcriptomics: importance of β-tubulin isotypes for osteoclast function. J Cell Sci. 2020;133(10):jcs239772. doi:10.1242/jcs.239772 DOI: https://doi.org/10.1242/jcs.239772
Matsubara T, Yaginuma T, Addison WN, Fujita Y, Watanabe K, Yoshioka I, et al. Plectin stabilizes microtubules during osteoclastic bone resorption by acting as a scaffold for Src and Pyk2. Bone. 2020;132:115209. doi:10.1016/j.bone.2019.115209 DOI: https://doi.org/10.1016/j.bone.2019.115209
Okumura S, Mizoguchi T, Sato N, Yamaki M, Kobayashi Y, Yamauchi H, et al. Coordination of microtubules and the actin cytoskeleton is important in osteoclast function, but calcitonin disrupts sealing zones without affecting microtubule networks. Bone. 2006;39(4):684-93. doi:10.1016/j.bone.2006.04.010 DOI: https://doi.org/10.1016/j.bone.2006.04.010
Kodama J, Kaito T. Osteoclast multinucleation: review of current literature. Int J Mol Sci. 2020;21(16):5685. doi:10.3390/ijms21165685 DOI: https://doi.org/10.3390/ijms21165685
Li GF, Pan YZ, Sirois P, Li K, Xu YJ. Iron homeostasis in osteoporosis and its clinical implications. Osteoporos Int. 2012;23(10):2403-8. doi:10.1007/s00198-012-1982-1 DOI: https://doi.org/10.1007/s00198-012-1982-1
Balogh E, Tolnai E, Nagy B, Nagy B, Balla G, Balla J, et al. Iron overload inhibits osteogenic commitment and differentiation of mesenchymal stem cells via the induction of ferritin. Biochim Biophys Acta. 2016;1862(9):1640-9. doi:10.1016/j.bbadis.2016.06.003 DOI: https://doi.org/10.1016/j.bbadis.2016.06.003
Wang H, Shi H, Rajan M, Canarie ER, Hong S, Simoneschi D, et al. FBXL5 regulates IRP2 stability in iron homeostasis via an oxygen-responsive [2Fe2S] cluster. Mol Cell. 2020;78(1):31-41.e35. doi:10.1016/j.molcel.2020.02.011 DOI: https://doi.org/10.1016/j.molcel.2020.02.011
Johnson NB, Deck KM, Nizzi CP. Eisenstein RS: a synergistic role of IRP1 and FBXL5 proteins in coordinating iron metabolism during cell proliferation. J Biol Chem. 2017;292(38):15976-89. doi:10.1074/jbc.M117.785741 DOI: https://doi.org/10.1074/jbc.M117.785741
Liu H, Wang YW, Chen WD, Dong HH, Xu YJ. Iron accumulation regulates osteoblast apoptosis through lncRNA XIST/miR-758-3p/caspase 3 axis leading to osteoporosis. IUBMB Life. 2021;73(2):432-43. doi:10.1002/iub.2440 DOI: https://doi.org/10.1002/iub.2440
Article files
Additional Files
Publication details
- Citation
- Vol. 26 No. 2 (2026), pp. 354–367
- Language
- EN
- License
- CC BY 4.0
- Section
- Research article
How to cite (Vancouver)
Tan Y, Wang Y, Zhu Q, Xue Y, Ji X, Li Z, et al. Identification and validation of TUBB, CLTA, and FBXL5 as potential diagnostic markers of postmenopausal osteoporosis. Biomol Biomed. 2025;26(2):354–367. https://doi.org/10.17305/bb.2025.12019