Mathematical methods for quantification and comparison of dissolution testing data

Authors

  • Edina Vranić Department of Pharmaceutical Technology
  • Aida Mehmedagić Department of Pharmacokinetics, University of Sarajevo, Faculty of Pharmacy
  • Sabira Hadžović Department of Pharmaceutical Technology

DOI:

https://doi.org/10.17305/bjbms.2002.3581

Keywords:

dissolution testing, difference factor, similarity factor, quantification, comparison, solid dosage forms

Abstract

In recent years, drug release/dissolution from solid dosage forms has been the subject of intense and profitable scientific developments. Whenever a new solid dosage form is developed or produced, it is necessary to ensure that drug dissolutionoccurs in an appropriate manner. The pharmaceutical industry and the registration authorities do focus, nowadays, on drug dissolution studies. The quantitative analysis of the values obtained in dissolution/release tests is easier when mathematicalformulas that express the dissolution results as a function of some of the dosage forms characteristics are used. This work discusses the analysis of data obtained for dissolution profiles under different media pH conditions using mathematical methodsof analysis described by Moore and Flanner. These authors have described difference factor (f1) and similarity factor (f2), which can be used to characterise drug dissolution/release profiles. In this work we have used these formulas for evaluation of dissolution profiles of the conventional tablets in different pH of dissolution medium (range of physiological variations).

Downloads

Download data is not yet available.
Mathematical methods for quantification and comparison of dissolution testing data

Published

2002-02-20

How to Cite

1.
Vranić E, Mehmedagić A, Hadžović S. Mathematical methods for quantification and comparison of dissolution testing data. Biomol Biomed [Internet]. 2002Feb.20 [cited 2023Sep.23];2(1-2):49-52. Available from: https://www.bjbms.org/ojs/index.php/bjbms/article/view/3581

Issue

Section

Reviews

Introduction

Over the years, dissolution testing has been employed as a quality control procedure in pharmaceutical production, in product development to assist in selection of a candidate formulation. It was also used in research to detect the influence of critical manufacturing variables, such as: binder effect (1), mixing effect (2), granulation procedure (3), coating parameters (4) and/or in comparative studies of different formulations (5), in in vitro-in vivo correlations (6).

It becomes apparent that sensitive and reproducible dissolution data derived from physicochemically and hydro-dynamically defined conditions are necessary in order to compare various in vitro dissolution data. Such results can be used: as a surrogate for possible in vivo bioavail-ability, bioequivalence testing, and in vitro-in vivo correlation (ivivc). However, the influence of technological differences and process variables involved during manu-facturing often complicates the decision making process in selection of the appropriate dissolution method and subsequent data interpretation technique. Skoug and co-workers (7) stressed that this consequence is the reason for dissolution studies. The defined specifications so often generate strong interest during regulatory review of solid oral dosage forms.

The currently available USP-25 has been one of the most valuable references to pharmaceutical scientists involved in the area of dissolution studies. The available dissolution methods within individual drug monographs have been divided, into immediate and controlled or extended release products. Except the prominence given to differences in specifications such as tolerance (Q) values between immediate and controlled release products, there are no substantial differences in the methodologies used to test these products.

When regulatory activities are concerned Emea-cpmp Note for Guidance (8) suggests below mentioned purpose of dissolution testing:

  • to get information on the best test batches used in bioavailability/bioequivalence studies and pivotal clinical studies to support specification for routine quality control

  • to be used as a tool in quality control to demonstrate consistency in manufacture

  • to get information on the reference product used in bioavailability/bioequivalence studies and pivotal clinical studies

  • to compare reference products from different Member States

  • to help to ascertain similarity between different formulations of a drug substance (variations and new, essentially similar products included) and the reference medicinal product

Expected differences in dissolution test methods may include variation in the pH of the dissolution medium depending on where the drug dissolves or depending on the drug release rate, drug solubility and absorption profile. In most cases, the monographs are not up to date. The necessary refinement reflecting the recent advances in research finding with the respect to changes in media and methods are not included.

In the past decade many approaches have been proposed for the comparison of dissolution profiles. In spite of the development of complicated approaches, the main problem persists in the comparison process to define an exact measure of quantification.

The recent guidelines by the CDER at the FDA (9) describes the necessary criteria for granting bio-waivers for specific changes in drug product manufacturing such us formulation changes or even changes in manufacturing site. To this end, the guidelines and specific published work (10,11) on extended release solid oral dosage forms describe the mathematical treatment of dissolution data derived from the pre-and post-approval changes by comparing their release profiles using the “similarity factor, which may be defined as follows:

where n is the number of dissolution time points, ω{ is an optional weight factor, Rt is the reference assay at time point t. The “reference” and “test” products may be identical formulations. Optimisation of release profiles may be achieved by the appropriate adoption of standard or alternative dissolution methods.

In addition, moore and Flanner in their work also describe a f fit factor or “difference factor” as follows:

where f describes the relative error between two dissolution profiles. “It approximates the percent error between two curves. The percent error is zero when the test and reference profiles are identical and increases proportionally with the dissimilarity between the two profiles”.

In these work we use mathematical approach for evaluation of dissolution profile of diazepam conventional tablets in pH of dissolution medium. In the period of time needed for dissolution (thirty minutes), the sampling time points were set-up to obtain profile which was supposed to have different characteristics for the dissolution media of different acidity (range of physiological variations).

Material and Methods

Commercially available conventional tablets of diazepam (Bosaurin®, 5 mg tablets, Bosnalijek, Sarajevo, Bosnia and Herzegovina) were used as a test sample. Dissolution tests were performed using the usp Apparatus 1 (ERWEKA DT, Heusenstamm, Germany).

Experiments were conducted to study the effect of varying the pH value of the dissolution medium within the physiological relevant range. Two different pH values between 1.0 and 2.0 were chosen. Media used for these experiments were 0.1mol/l hydrochloric acid and 0.01mol/l hydrochloric acid.

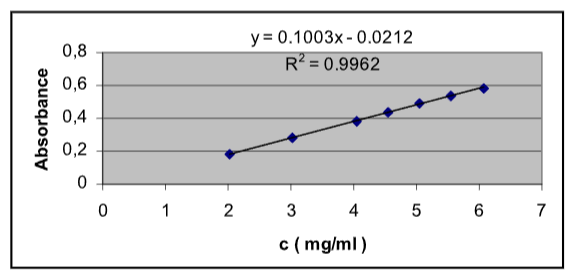
Fixed volumes of the dissolution medium (5 ml) were withdrawn at 5, 10, 15, 20, 25 and 30 minutes for UV assay at 242 nm. The amounts of diazepam released in dissolution medium were calculated from calibration curves (Figure 1 and Figure 2). The data were analysed using f1 and f2 equations proposed by moore and Flanner.

Figure 1: Calibration curve of diazepam in 0.1 mol / l HCl solution
Figure 2: Calibration curve of diazepam in 0.01 mol / l HCl solution

Results

The results of dissolution studies are summarised in Table I and Table II and Figure 3 which show the percentage of drug dissolved as a function of time.

Figure 3: Comparative display of dissolution profile for diazepam tablets in 0.1 mol / l HCl (pH=1.0) and in in 0.01 mol / l HCl (pH=2.0).
Table I: Percentage of dissolved diazepam from the tablets as a function of time in 0.1 mol / l HCl.
Table II: Percentage of dissolved diazepam from the tablets as a function of time in 0.01 mol / l HCl.

The f2 value between 50 and 100 suggests that the dissolution profiles are similar. The f2 value of 100 suggests that the test and reference release profiles are identical. As the value becomes smaller, the dissimilarity between release profiles increases. f2 equation is a logarithmic transformation of the sum of squared error. It takes the average sums of squares of the difference between test and reference profiles and fits the result between 0 and 100. It is important to note that f2 equation is for the comparison of dissolution curves in which the average difference between Rt and Tt is <100. The use of the weight factor allows some values to be more important than other values, where wt will be >1. If all values are treated equally, then ωt=1.0.

Interpolating these data in f2 and f1 equation we obtained vales f2 = 23.16 and f1 = 34.15. These values indicate that there are great differences in drug release from investigated diazepam tablets. Although pH value of the dissolution medium was varied in relatively small interval (1.0 — 2.0), there was a great difference in drug release in different pH.

Conclusions

Application of f1 and f2 equations show expected differences in time-course of diazepam dissolution in a range of physiological conditions. Obtained differences in the dissolution profile of diazepam conventional tablets in different pH values indicate that dissolution study should be followed through different pH values of the medium. With the advent of international harmonisation of scientific protocols and implementation of Supac guidelines including site-to site manufacturing conditions, such process comparisons have important regulatory implications. Although not infallible, the most often used statistical approach at this stage appears to be the use of f2 similarity factor and f1 difference factor. These two model-independent measures surpass all other techniques for the profile comparison in their unique ability to complete profile characterisation. However, more data on their utility in conjunction with similarity of in vivo drug absorption profiles will provide the ultimate measure of their discerning potential.

References